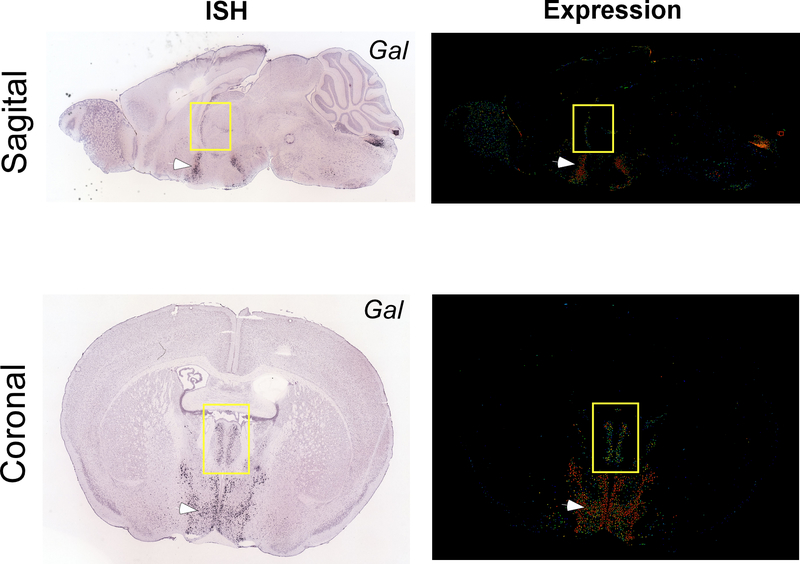
Extended Data Fig. 9. Gal expression in the PVT is relatively lower compared to the hypothalamus.
Sagittal (top) and coronal (bottom) sample images from two independent Gal ISH experiments from the Mouse Gene Expression Atlas of the Allen Brain Institute. Notice that Gal expression in the PVT (yellow rectangle) is appreciably lower when compared to expression observed in the hypothalamus (arrow).

