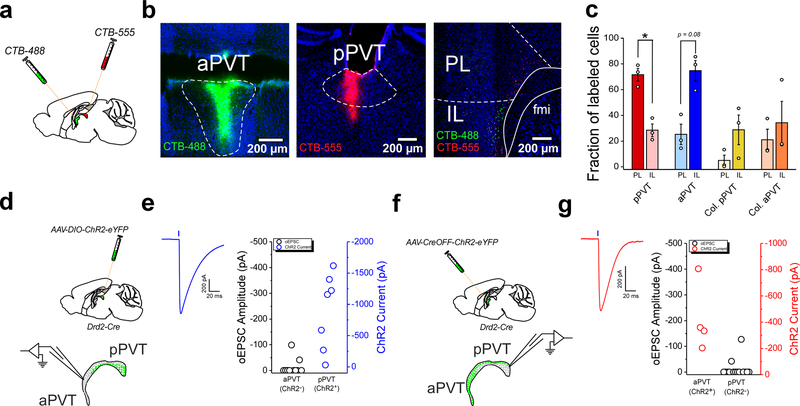
Figure 2. Type I and Type II neurons of the PVT are integrated into independent thalamo-corticothalamic loops.
a. Schematic of the retrograde tracing strategy used to label mPFC neurons projecting to the most anterior and posterior regions of the PVT. b. Representative images showing the injection sites for CTB-488 and CTB-555 in the aPVT and pPVT, respectively. A representative image of the distribution of retrogradely-labeled cells in the mPFC is shown on the right. c. Quantification of the fraction of retrogradely labeled cells found in the PL and IL regions of the mPFC for each CTB injected subject. Fraction of labelled cells, pPVT: PL, 71.56 ± 4.595; IL, 28.44 ± 4.95, n = 3 mice, *P=0.049, two-sided Paired sample t-test; aPVT: PL, 25.25 ± 7.92; IL, 74.75 ± 8.58, n = 3 mice, P=0.08, two-sided Paired sample t-test. d. Schematic of the electrophysiology experiment to assess functional Type I to Type II connectivity in the PVT. A Cre-dependent AAV vector expressing ChR2-eYFP was injected in the PVT of Drd2-Cre mice. Acute slices containing the PVT were prepared 2–3 weeks after the injection. e. Left: sample trace showing optically-evoked responses in ChR2+ cells. Right: oEPSC (ChR2−; black open circles) and ChR2 current (blue open circles) amplitudes measured at −70 mV in the aPVT and the pPVT, respectively following light stimulation (5 ms light pulses). ChR2 currents were detected in all ChR2+ neurons probed (n = 7 neurons from 2 mice). oEPSCs were detected in only a small fraction of neurons (n = 2/10 from 2 mice). f. Schematic of the electrophysiology experiment to assess functional Type II to Type I connectivity in the PVT. A CreOFF AAV vector expressing ChR2-eYFP was injected in the PVT of Drd2-Cre mice. Acute slices containing the PVT were prepared 2–3 weeks after the injection. g. Left: sample trace showing optically-evoked responses in ChR2+ cells. Right: oEPSC (ChR2−; black open circles) and ChR2 current (red open circles) amplitudes measured at −70 mV in the pPVT and the aPVT, respectively following light stimulation (5 ms light pulses). ChR2 currents were detected in all ChR2+ neurons probed (n = 4 neurons from 2 mice). oEPSCs were detected in only a small fraction of neurons (n = 2/15 from 2 mice). Data shown as mean ± s.e.m.

