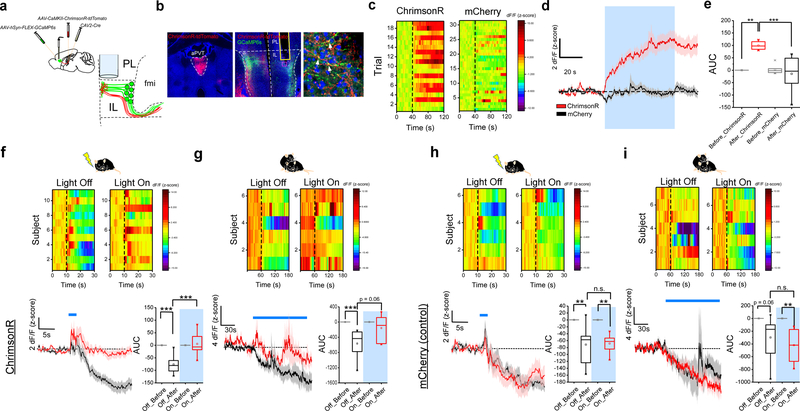
Figure 3. PVT input shapes neuronal representations of salient stimuli in IL.
a. Schematic of the viral vector strategy and optical fiber placement used for combined fiber photometry imaging of GCaMP6s fluorescence from ILPVT neurons and optogenetic manipulation of the terminals of Type II PVT neurons in the IL. b. Representative images from a subject expressing ChrimsonR-tdTomato in the aPVT (left) and GCaMP6s in ILPVT neurons (middle). A high magnification image of a portion of the IL immediately below the tip of the optical fiber shows putative synaptic contacts (arrows) between the dendrites of GCaMP6s-expressing ILPVT neurons and tdTomato-labelled axons arising from the aPVT (right). c. Heatmap showing individual GCaMP6s responses to light stimulation (561 nm at 20 Hz) from both ChrimsonR- and mCherry-expressing (control) subjects. d. Average GCaMP6s responses from ILPVT neurons in ChrimsonR (red) and mCherry (black) expressing animals subjected to light stimulation, n = 6 mice per group. e. Quantification of light-evoked changes in GCaMP6s fluorescence in ILPVT neurons. AUC: Before_ChrimsonR, −0.04 ± 0.01; After_ChrimsonR, 99.32 ± 7.13; Before_mCherry, 3.32 ± 7.95; After_mCherry, −14.45 ± 30.25, n = 6 mice per group; F(3,20) = 11.85, two-way ANOVA followed by Tukey’s test. Group comparisons: Before_ChrimsonR vs After_ChrimsonR, **P=0.002; After_ChrimsonR vs After_mCherry, ***P=0.0004; Before_mCherry vs After_mCherry, P=0.86. f. Top: heatmap of average GCaMP6s responses to footshocks from individual ChrimsonR-expressing subjects. Bottom left: average GCaMP6s response from ILPVT neurons in ChrimsonR-expressing animals subjected to footshocks in the presence (red) and absence (black) of light stimulation (561 nm at 20 Hz), n = 11 mice. Footshock duration is depicted by the blue line above the trace. Bottom right: quantification of footshock-evoked changes in GCaMP6s fluorescence in ILPVT neurons in the presence and absence of light stimulation. AUC, Off_Before, −0.01 ± 0.06; Off_After, −76.45 ± 11.24; On_Before, 0.002 ± 0.05; On_After, 5.48 ± 12.84, n = 11 mice; F(3,40) = 21.12, two-way ANOVA followed by Tukey’s test. Group comparisons: Off_Before vs Off_After, ***P=0.0000009; On_Before vs On_After, P=0.97; Off_After vs On_After, ***P=0.0000002. g. Top: heatmap of average GCaMP6s responses to social interaction from individual ChrimsonR-expressing subjects. Bottom left: average GCaMP6s response from ILPVT neurons in ChrimsonR-expressing animals subjected to social interaction in the presence (red) and absence (black) of light stimulation (561 nm at 20 Hz), n = 6 mice. The duration of the interaction bouts is depicted by the blue line above the trace. Bottom right: quantification of social interaction-evoked changes in GCaMP6s fluorescence in ILPVT neurons in the presence and absence of light stimulation. AUC, Off_Before, −0.02 ± 0.04; Off_After, −566.72 ± 162.67; On_Before, 0.10 ± 0.18; On_After, −158.58 ± 144.53, n = 6 mice; F(3,20) = 6.05, two-way ANOVA followed by Tukey’s test. Group comparisons: Off_Before vs Off_After, **P=0.007; On_Before vs On_After, P=0.73; Off_After vs On_After, P=0.06. h. Top: heatmap of average GCaMP6s responses to footshocks from individual control subjects. Bottom left: average GCaMP6s response from ILPVT neurons in mCherry-expressing control animals subjected to footshocks in the presence (red) and absence (black) of light stimulation, n = 6 mice. Footshock duration is depicted by the blue line above the trace. Bottom right: quantification of footshock-evoked changes in GCaMP6s fluorescence in ILPVT neurons in the presence and absence of light stimulation. AUC, Off_Before, 0.08 ± 0.06; Off_After, −71.51 ± 24.82; On_Before, −0.07 ± 0.10; On_After, −68.5 ± 11.87, n = 6 mice; F(3,20) = 8.64, two-way ANOVA followed by Tukey’s test. Group comparisons: Off_Before vs Off_After, **P=0.007; On_Before vs On_After, **P=0.01; Off_After vs On_After, P=0.99. i. Top: heatmap of average GCaMP6s responses to social interaction from individual control subjects. Bottom left: average GCaMP6s response from ILPVT neurons in mCherry-expressing control animals subjected to social interaction in the presence (red) and absence (black) of light stimulation, n = 7 mice. The duration of the interaction bouts is depicted by the blue line above the trace. Bottom right: quantification of social interaction-evoked changes in GCaMP6s fluorescence in ILPVT neurons in the presence and absence of light stimulation. AUC, Off_Before, 0.04 ± 0.04; Off_After, −299.29 ± 128.64; On_Before, −0.03 ± 0.02; On_After, −420.27 ± 96.02, n = 7 mice; F(3,24) = 7.07, two-way ANOVA followed by Tukey’s test. Group comparisons: Off_Before vs Off_After, P=0.06; On_Before vs On_After, **P=0.005; Off_After vs On_After, P=0.71. Box chart legend: box is defined by 25th, 75th percentiles, whiskers are determined by 5th and 95th percentiles, and mean is depicted by the square symbol. Data shown as mean ± s.e.m.

