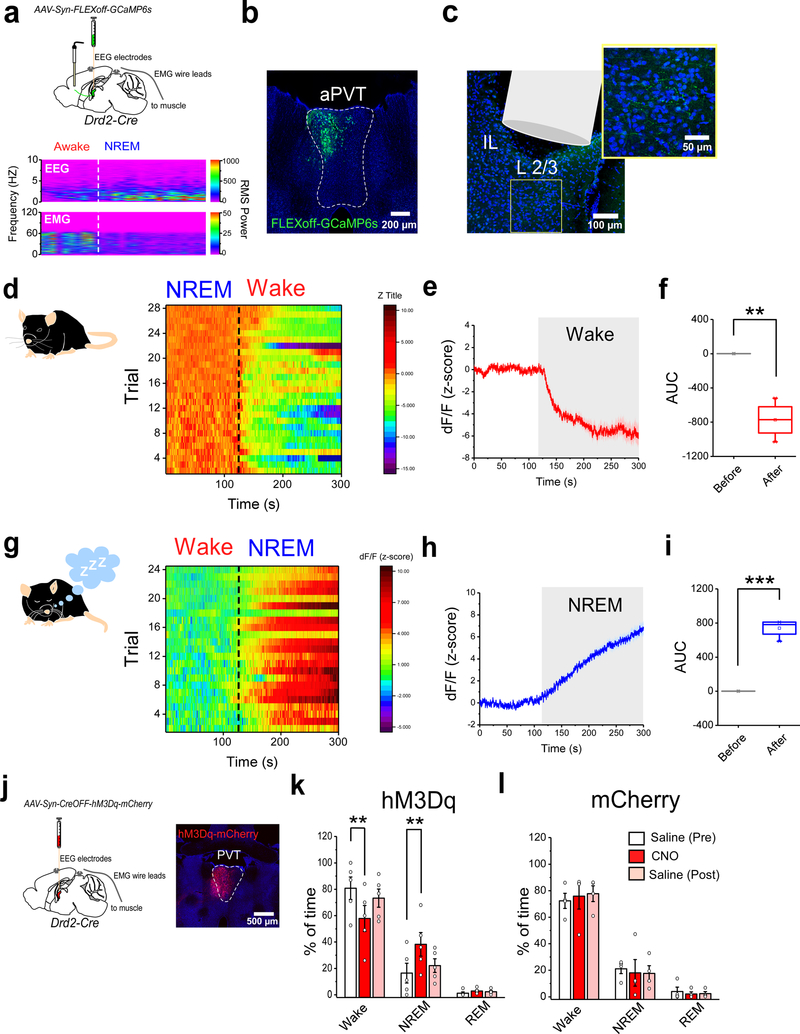
Figure 4. Type II neurons of the PVT signal arousal states.
a. Top: schematic of the viral vector strategy, optical fiber placement and EEG/EMG device implantation used for combined fiber photometry imaging of Type II PVT terminals in the IL and polysomnographic recordings. Bottom panel: sample EEG/EMG recording. Dashed lines depict state transitions between Awake and NREM sleep states. b. Representative image from a subject expressing GCaMP6s in Type II neurons within the aPVT. c. Representative image of the optical fiber placement in IL. A high magnification image of a portion of the IL immediately below the tip of the optical fiber showing GCaMP6s-expresing terminals. d. Heatmap showing individual GCaMP6s responses from Type II PVT terminals to NREM-Wake transitions for all subjects. e. Average GCaMP6s response from the terminals of Type II PVT neurons during NREM-Wake transitions (Wake depicted by shaded area), n = 4 mice. f. Quantification of GCaMP6s responses from the terminals of Type II PVT neurons for all NREM-Wake transitions. AUC: Before, 0.12 ± 0.06; After, −773.88 ± 106.15, n = 4 mice, **P=0.005, two-sided Paired sample t-test. g. Heatmap showing individual GCaMP6s responses from Type II PVT terminals to Wake-NREM transitions for all subjects. h. Average GCaMP6s response from the terminals of Type II PVT neurons during Wake-NREM transitions (NREM depicted by shaded area), n = 4 mice. i. Quantification of GCaMP6s responses from the terminals of Type II PVT neurons for all Wake-NREM transitions. AUC: Before, −0.47 ± 0.27; After, 739.28 ± 53.04, n = 4 mice, ***P=0.0008, two-sided Paired sample t-test. j. Schematic of the experimental approach used to assess the effect of chemogenetic activation of Type II neurons on sleep/wake state. A representative image of hM3Dq-mCherry expression in Type II neurons within the aPVT. k. Quantification of the percent of time spent in Wake, NREM, and REM sleep states 2 h following IP injection of saline (white and pink bars) or CNO (red bars) in hM3Dq-expressing mice (n = 5 mice). Percent time, Wake: Saline (Pre), 80.72 ± 8.50; CNO, 57.8 ± 9.82; Saline (post), 73.22 ± 6.88; **P=0.002, two-sided Paired sample t-test. NREM: Saline (Pre), 16.40 ± 7.49; CNO, 38.20 ± 8.93; Saline (post), 22.07 ± 5.16. **P=0.007, two-sided Paired sample t-test. REM: Saline (Pre), 1.16 ± 0.96; CNO, 2.80 ± 0.86; Saline (post), 2.39 ± 1.03. l. Quantification of the time spent in Wake, NREM, and REM sleep states 2 h following IP injection of saline (white and pink bars) or CNO (red bars) in mCherry-expressing (control) mice (n = 4 mice). Percent time, Wake: Saline (Pre), 72.30 ± 5.70; CNO, 75.83 ± 9.72; Saline (post), 77.70 ± 5.93. NREM: Saline (Pre), 21.08 ± 3.61; CNO, 18.01 ± 10.03; Saline (post), 17.60 ± 5.77. REM: Saline (Pre), 3.95 ± 3.27; CNO, 2.06 ± 1.64; Saline (post), 2.35 ± 1.50. Box chart legend: box is defined by 25th, 75th percentiles, whiskers are determined by 5th and 95th percentiles, and mean is depicted by the square symbol. Data shown as mean ± s.e.m.

