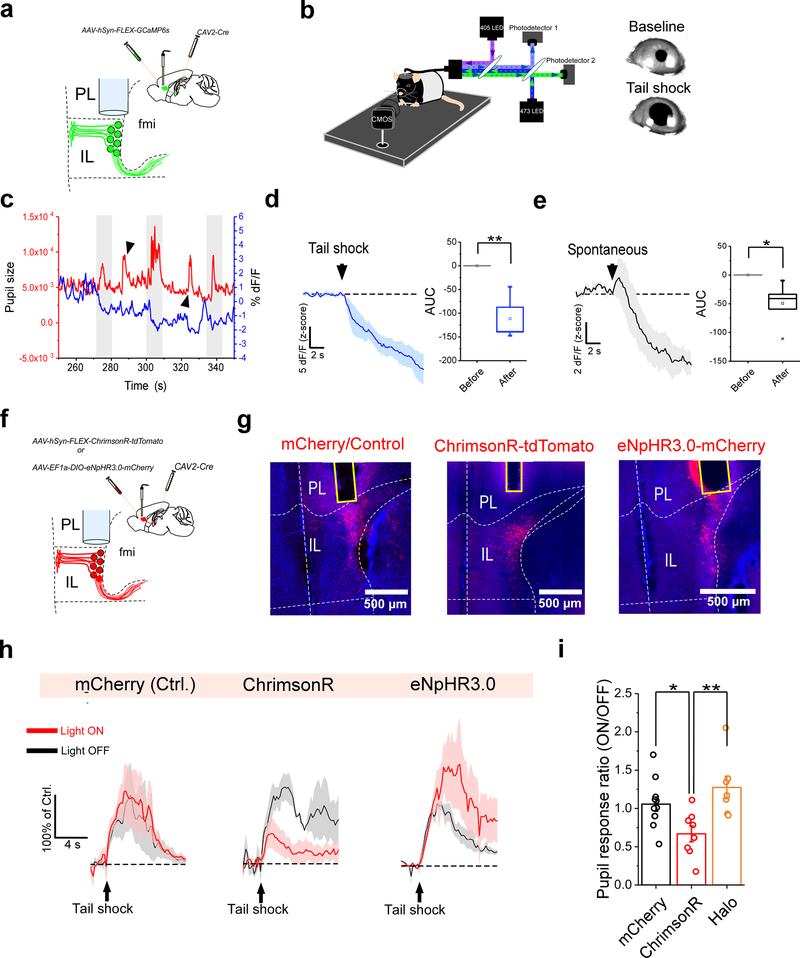
Figure 6. The IL controls physiological arousal in response to salient stimuli.
a. Schematic of the viral vector strategy and optical fiber placement used for combined fiber photometry imaging of GCaMP6s fluorescence from ILPVT neurons and pupillometry. b. Left: diagram of the experimental setup used for head-fixed pupillomery used in conjunction with fiber photometry or optogenetics. Right: representative images of tail shock-evoked pupil dilations obtained in our recording sessions. c. Sample trace of pupil size (area) and ILPVT GCaMP6s signal from an individual recording session. Note that pupil dilations largely coincide with decreases in GCaMP6s fluorescence for both tail shock-evoked (arrowheads) and spontaneously occurring (gray shaded) pupil dilations. d. Left: Average GCaMP6s response from ILPVT neurons during tail shocks. Right: quantification of GCaMP6s responses to tail shocks, n = 6 mice. AUC, Before, −0.02 ± 0.05; After, −111.62 ± 19.94, n = 6 mice, **P=0.005, two-sided Paired sample t-test. e. Left: Average GCaMP6s response from ILPVT neurons during spontaneously occurring pupil dilations, n = 6 mice. Right: quantification of the GCaMP6s responses during spontaneous pupil dilations. AUC, Before, 0.002 ± 0.04; After, −49.33 ± 14.02, n = 6 mice, *P=0.02, two-sided Paired sample t-test. f. Schematic of the viral vector strategy and optical fiber placement used for combined optogenetic manipulation of ILPVT neurons and pupillometry. g. Representative images depicts mCherry (left), ChrimsonR-tdTomato (middle) and Halo-mCherry (right) expression, and optical fiber placement in IL. h. Average pupil responses during ‘light off’ (gray) and ‘light on’ (red) tail shock trials for representative subjects expressing either mCherry (left), ChrimsonR (center) or Halo (right) in ILPVT neurons, n = 10 trials per sample subject (5 trials were ‘light off’ and 5 trials were ‘light on’). i. Quantification of the ratio of ‘light on’/’light off’ pupil dilations following tail shocks. AUC, mCherry, 1.06 ± 0.09, n = 11 mice; ChrimsonR 0.67 ± 0.10, n = 8 mice; Halo, 1.27± 0.15, n = 7 mice; F(2,23) = 6.66, one-way ANOVA followed by Tukey’s test. Group comparisons: mCherry vs ChrimsonR, *P=0.047; mCherry vs Halo, P=0.37; ChrimsonR vs Halo, ***P=0.005. Box chart legend: box is defined by 25th, 75th percentiles, whiskers are determined by 5th and 95th percentiles, and mean is depicted by the square symbol. Data shown as mean ± s.e.m.

