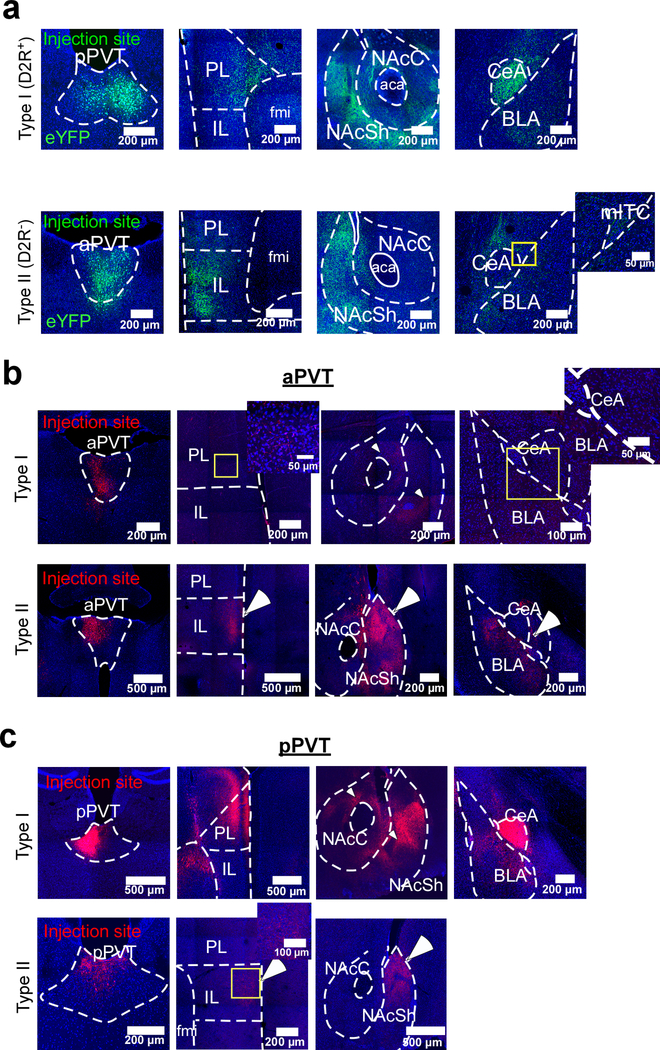
Extended Data Fig. 2. Anatomical projections from Type I and Type II neurons of the PVT.
a. Representative images showing the distribution of axonal projections from Type I neurons of the pPVT (top) and Type II neurons of the aPVT (bottom) across three major PVT targets: the mPFC, the NAc and the amygdala (data from 3 mice). b. Representative images showing the distribution of the axonal projections from Type I (top) and Type II (bottom) neurons of the aPVT across the mPFC, the NAc and the amygdala. Notice that since Type I neurons are rather scarce in the aPVT, the efferent projections from these neurons are sparse and more difficult to resolve. Data from 2 mice. c. Representative images show the distribution of the axonal projections from Type I (top) and Type II (bottom) neurons of the pPVT across the mPFC, the NAc and the amygdala. Because only a few Type II neurons populate the pPVT, the efferent projections from these neurons are sparse and not as dense when compared to those of Type I neurons. Data from 2 mice. Arrowheads indicate regions selectively innervated by Type I neurons, whereas arrows indicate regions selectively innervated by Type II neurons. Magnifications of the areas depicted by the yellow boxes are shown as inserts. Anterograde tracing experiments were independently repeated three times, with similar results obtained across repetitions.

