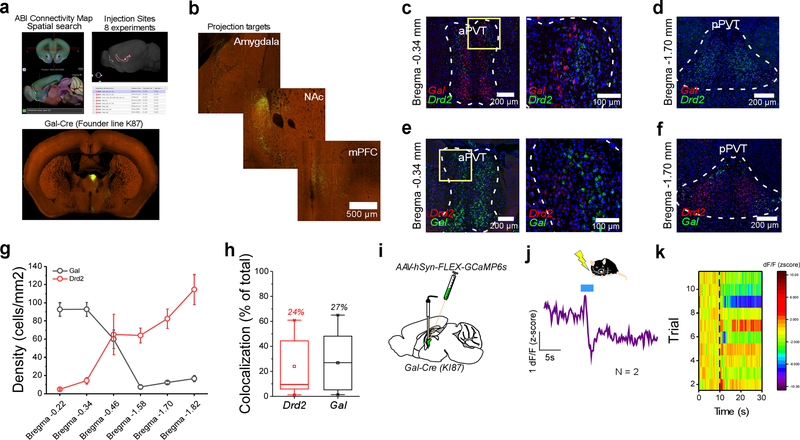
Extended Data Fig. 3. Type II neurons selectively express Galanin (Gal).
a. Schematics of the Spatial Search tool used to identify experiments in which PVT projections to the IL were detected (Mouse Brain Connectivity Atlas of the Allen Brain Institute). b. Sample images from Experiment # 204908781 (Gal-Cre:KI87) demonstrating that the axonal projections of Gal+ neurons of the PVT resemble those of Type II neurons (Extended Data Fig. 2). c. Representative images from our multiplexed RNAscope experiment aimed at detecting Gal (red) and Drd2 (green) expression in the aPVT (left). Insert shows magnified portion depicted by the yellow box (right). d. Representative images from our multiplexed RNAscope experiment aimed at detecting Gal (red) and Drd2 (green) expression in the pPVT. e. Same as c with counterbalanced channels. f. Same as d with counterbalanced channels. g. Quantification of Gal and Drd2 expression across six different bregma locations, n = 5 sections per bregma location (data from 4 mice). h. Box plot shows percent colocalization for both Drd2 (red) and Gal (black) across all bregma locations, n = 5 sections per bregma location (data from 4 mice). Multiplexed RNAscope experiments for simultaneous detection of Gal and Drd2 in the PVT were independently repeated four times, with probe channels counterbalanced across repetitions. All independent repetitions yielded similar results. Box chart legend: box is defined by 25th, 75th percentiles, whiskers are determined by 5th and 95th percentiles, and mean is depicted by the square symbol. i. Schematic of the stereotaxic injection used to selectively target expression of GCaMP6s to Gal+ neurons of the aPVT of Gal-Cre mice. j. Average GCaMP6s responses to footshocks from Gal+ neurons of the PVT (n = 2 mice). Footshock duration depicted by the blue line above the trace. k. Heatmap of dF/F for all individual trials. Data shown as mean ± s.e.m.

