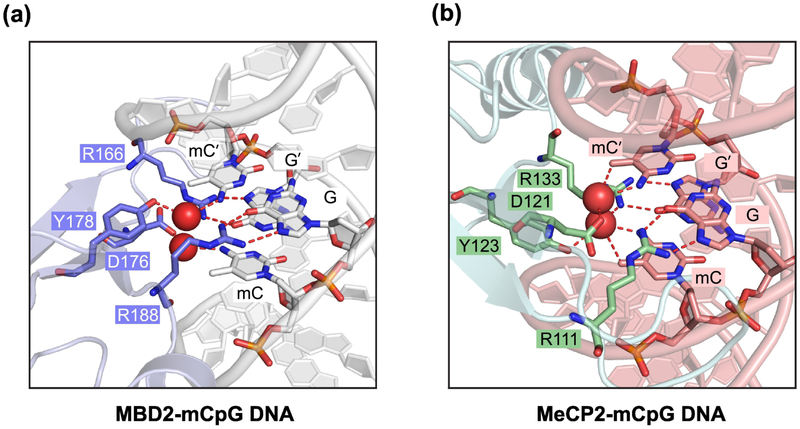
Figure 2. Crystal structures of 5mC readers in complex with 5mC-containing DNA.
(A) Ribbon diagram of the MBD domain of MBD2 (blue-white) bound to mCpG DNA (silver) (PDB 6CNP), with the mCpG site and the interacting protein residues (slate) shown in stick representation.
(B) The MBD domain of MeCP2 (light blue) bound to mCpG DNA (salmon) (PDB 3C2I), with the mCpG site and the interacting protein residues (green) shown in stick representation. In (A) and (B), the hydrogen bonds and water molecules are shown as dashed lines and red spheres, respectively.

