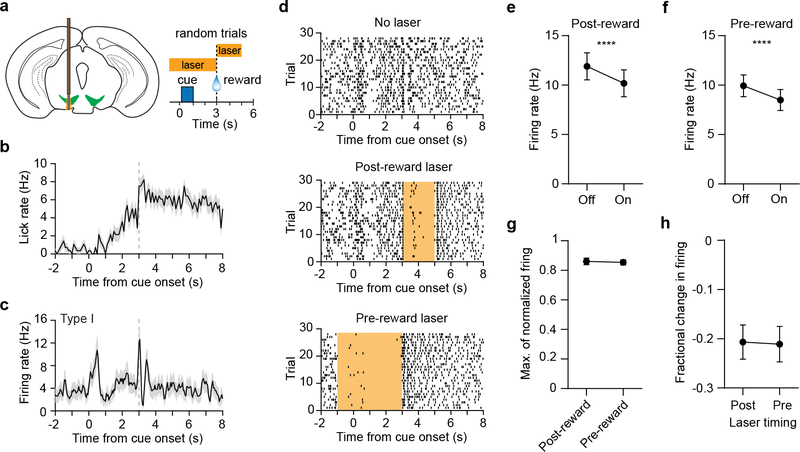
Fig. 2. Similar optogenetic reduction of DA neuron activity in the pre- and post-reward period.
a. (Left) Illustration of recording with a 64 electrode silicon microprobe during optogenetic inhibition of VTA DA neurons. (Right) Structure of the task during recordings. Trials consisted either of no laser, post-reward laser, or pre-reward laser (~33 % probability each, randomized order).
b. Mean lick rate versus time of one animal during recording, on laser-free trials (n = 28 trials).
c. Mean firing rate versus time of one Type I cluster cell (putative DA neuron) on laser-free trials (n = 28), recorded from the same animal as in (b).
d. Spike raster of the same neuron as in (c) on trials with no laser (top), post-reward laser (middle), and pre-reward laser (bottom). The orange bar indicates the timing of the laser.
e. The mean firing rate of Type I cells in the post-reward period was significantly reduced by application of post-reward laser (n = 85 cells, two-sided paired t-test, t84 = 5.7, P < 0.0001).
f. The mean firing rate of Type I cells in the pre-reward period was significantly reduced by application of pre-reward laser (n = 85, two-sided paired t-test, t84 = 4.4, P < 0.0001).
g. There was no significant difference in the mean of the maximum value of the normalized firing rate of Type I cells in the pre- and post-reward period (n = 85, two-sided paired t-test, t84 = 0.2, P = 0.84). Data represent trials with no laser.
h. There was no significant difference in the mean fractional change in firing rate of Type I cells by application of laser in the pre- and post-reward period (n = 85, two-sided paired t-test, t84 = 0.1, P = 0.91). Fractional change in post-reward firing rate: −20.7 ± 3.5 %, fractional change in pre-reward firing rate: −21.1 ± 3.6 %, mean ± SEM. Data are expressed as mean ± SEM.

