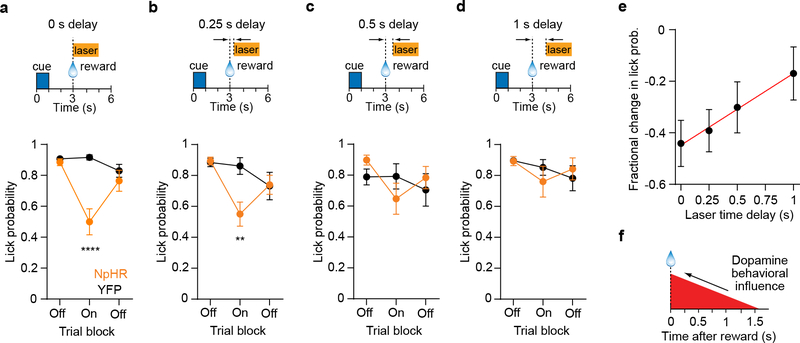
Fig. 7. Temporal dissection of the post-reward DA signal.
a. (Top) Trial structure of Pavlovian conditioning task with post-reward VTA DA inhibition. The laser onset has a delay of 0 s, and is delivered on trials 41 – 80 (2 s duration). (Bottom) Corresponding anticipatory probability per trial block for eNpHR3.0+ (n = 10 mice) and YFP+ (n = 11 mice) groups. Two-way RM ANOVA, group effect: F1,19 = 10.7, P = 0.004, trial block effect: F2,38 = 12.6, P < 0.0001. Post-hoc Sidak’s test: ****P < 0.0001.
b. (Top) Same trial structure as (a) but the laser onset has a delay of 0.25 s. (Bottom) Anticipatory lick probability per trial block for eNpHR3.0+ (n = 10 mice) and YFP+ (n = 11 mice) groups. Two-way RM ANOVA, group effect: F1,19 = 2, P = 0.17, trial block effect: F2,38 = 9.4, P = 0.005. Post-hoc Sidak’s test: **P = 0.002.
c. (Top) Same trial structure as (a) but the laser onset has a delay of 0.5 s. (Bottom) Anticipatory lick probability per trial block for eNpHR3.0+ (n = 10 mice) and YFP+ (n = 11 mice) groups. Two-way RM ANOVA, group effect: F1,19 = 0.02, P = 0.88, trial block effect: F2,38 = 3.3, P = 0.048. One of the mice in the YFP+ group had a low lick probability (0.425) in the first trial block, and can therefore be considered an outlier. Removing this subject from the ANOVA test did not appreciably change the results (group effect: F1,18 = 0.01, P = 0.94, trial block effect: F2,36 = 4.2, P = 0.02).
d. (Top) Same trial structure as (a) but the laser onset has a delay of 1 s. (Bottom) Anticipatory lick probability per trial block for eNpHR3.0+ (n = 10) and YFP+ (n = 11) groups. Two-way RM ANOVA, group effect: F1,19 = 0.02, P = 0.89, trial block effect: F2,38 = 3.3, P = 0.047.
e. Mean fractional change in lick probability as a function of laser time delay (n = 10 eNpHR3.0+ mice). Red line represents the best line fit to the data. Pearson R = 0.99, P = 0.003. The time axis intercept of the line occurs at 1.6 s (95 % confidence intervals: 1.4 – 2 s).
f. Illustration of the critical time window that requires DA neuron activity for reinforcing cue-reward associations, derived from the results in (e). Data are expressed as mean ± SEM.

