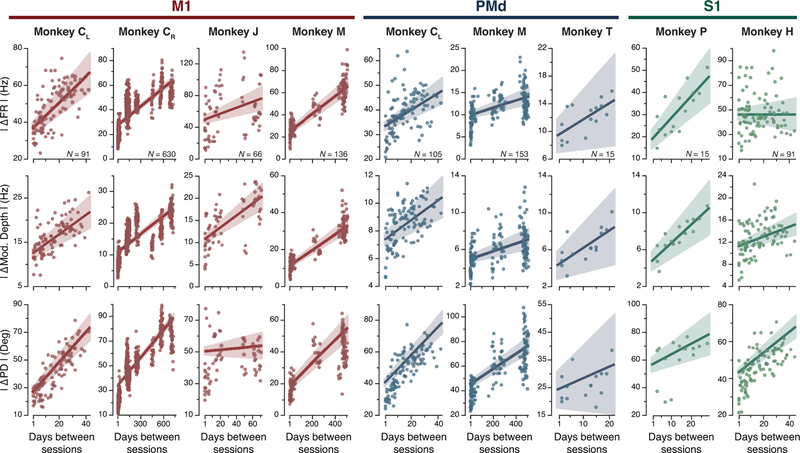
Extended Data Fig. 4. Additional data: neural tuning stability.
For each implant: change in mean firing rate (top plot), modulation depth (middle plot), and preferred direction (bottom plot) of standard cosine tuning fits to multiunit activity across all pairs of days. Line and shaded areas: mean ± s.e.m. Plots are grouped by implant and brain area (M1: left; PMd: middle; S1: right). Error bars: 95% confidence interval of linear fit. N: number of across-day comparisons.

