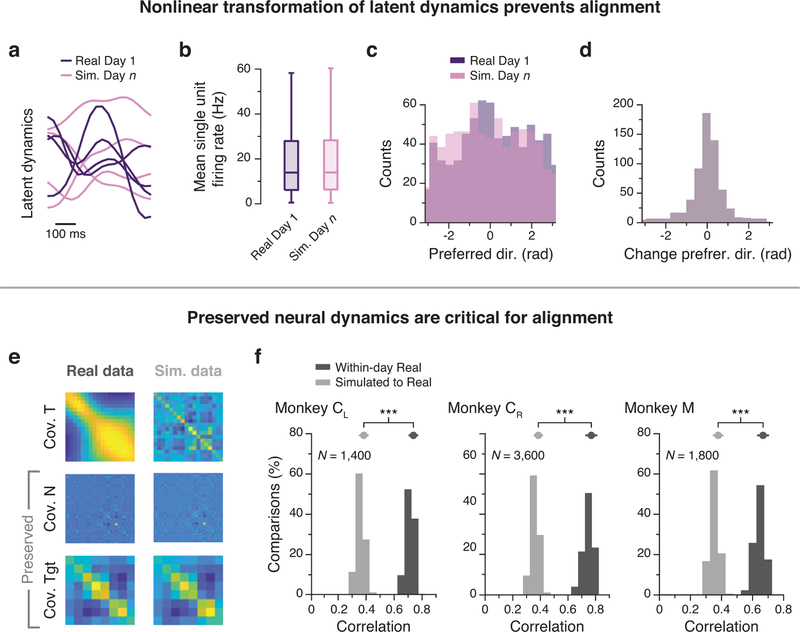
Extended Data Fig. 7. Additional data: Altering neural temporal dynamics prevents their alignment.
(a) Simulation showing that movement tuning does not account for unchanging latent dynamics, as in Fig. 6a–d. Latent dynamics from Day 1 (purple curves) are nonlinearly but smoothly transformed into latent dynamics of Day n (pink curves). The latent dynamics are shown as projections onto the four leading neural modes. (b) This transformation preserves neural firing statistics across the population. N=88 neurons; box plot shows median and 25th/75th percentiles, whiskers show range. (c,d) The statistics of preferred directions are also well-preserved across the population. Panels (a-d) present data pooled across all sessions from Monkey CL. (e) As an additional control, we used the TME method to generate simulated population neural activity that preserved the covariance across neurons and conditions (targets), while the covariance over time (dynamics) was not constrained to be preserved. Example data from Monkey CR. Legend: Cov. T: covariance over time; Cov. N: covariance across neurons; Cov. Tgt: covariance across targets. (f) Distribution of the averaged top four CCs between the simulated data and the recorded data for M1 recordings from three monkeys (grey). The distribution for the within-day averaged top four CCs for the recorded data (black) is shown for reference. ***: p< 0.001, two-sided Wilcoxon rank-sum test. Error bars: mean ± s.d. N: number of within-session comparisons.

