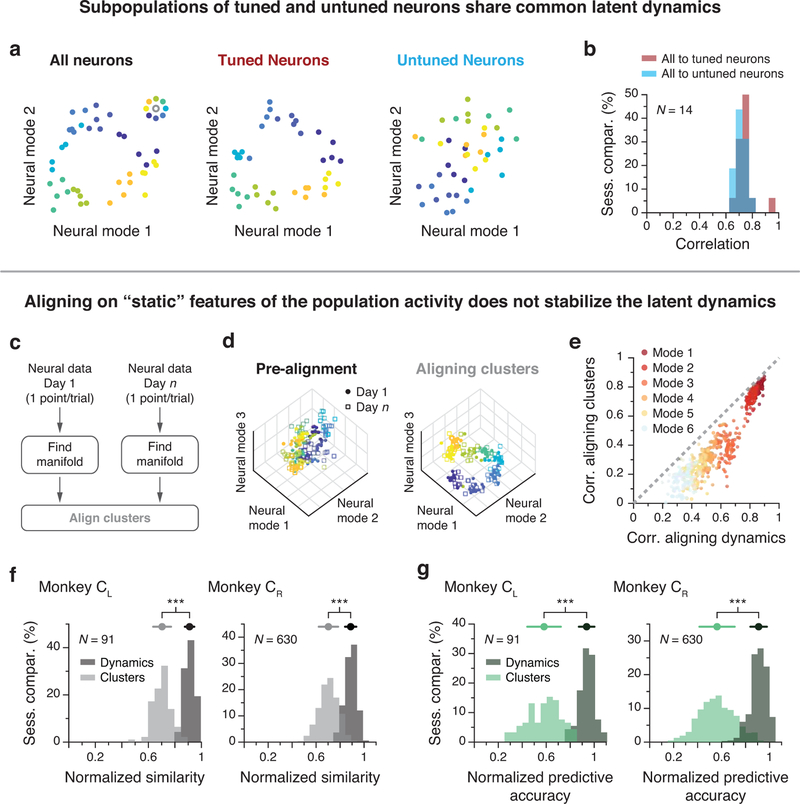
Extended Data Fig. 8. Additional control data: Stable latent dynamics are not a byproduct of single neuron tuning to movement.
(a) Contribution to the latent dynamics from tuned vs untuned neurons: The neural population was divided into two subpopulations based on the quality of a cosine fit to the activity of each neuron. The average activity in the neural manifold for reaches to each of the eight targets are shown for one example session; one data point per reach. The clustering by target direction observed in the full population (left) was preserved for the tuned subpopulation (middle) but not for the untuned subpopulation (right). (b) Distribution of the averaged top four CCs between the tuned subpopulation and the full population (red), and between the untuned subpopulation and the full population (blue) for all M1 sessions. The dynamics of the untuned population could be well aligned with the dynamics of the full population. Data pooled over all sessions from Monkey CL. (c) A static model based on movement tuning properties of individual neurons represents reaches to each target with one data point per trial and results in target-specific clusters that can be aligned. (d) Left: each point represents a reach to one of the eight targets (color code in inset) on Day 1 (closed circles) and Day n (open squares). Target specificity is mostly lost when these points are projected onto their respective manifolds. Right: after alignment, similar target-specific structure is present for both days. (e) Pairwise comparisons of the CCs after projecting the latent dynamics onto the manifold axes found by aligning the clusters (vertical axis) and onto the manifold axes found by aligning the latent dynamics (horizontal axis). Data shown for the top six neural modes (see legend for color code). Each dot represents one session comparison. All dots lie below the diagonal (dashed grey), indicating that aligning the statistics of the population activity based on target-specific clusters does not reach the CC values obtained by aligning the latent dynamics. (f) Canonical correlation values were significantly lower when the static clusters as opposed to the latent dynamics were aligned, illustrating the importance of the precise temporal dynamics for accurate alignment. (g) Consequently, across-day decoding was notably worse when aligning the static clusters.***: p < 0.001, two-sided Wilcoxon rank-sum test. Error bars: mean ± s.d. N: number of across-day comparisons.

