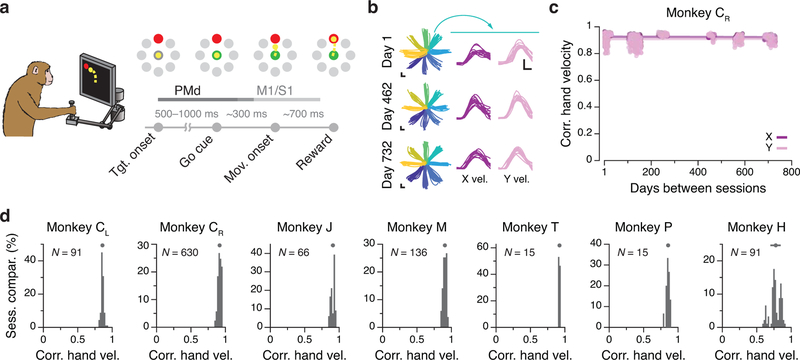
Figure 2.
Task and repeatability of behavior. (a) Monkeys performed an instructed-delay reaching task using a planar manipulandum. The schematic of the task indicates the approximate time windows used for analysis; these varied across cortical areas (PMd, M1, and S1). (b) Left: Example hand trajectories for three days spanning 731 days from Monkey CR. Each trace is an individual trial; traces are color-coded based on target location. Right: Example X and Y hand velocity traces for all reaches to the upper-right target on each of the three days. (c) Correlation (Pearson’s r) between direction-matched single trial X and Y hand velocities across all pairs of days from Monkey CR (single dots: individual pair of days; lines: linear fits). (d) Distribution of across-day hand velocity correlations (Pearson’s r) for all pairs of days for each of the seven sets of implants. Top error bars: mean ± s.d. N: number of across-day comparisons.

