Figure 4.
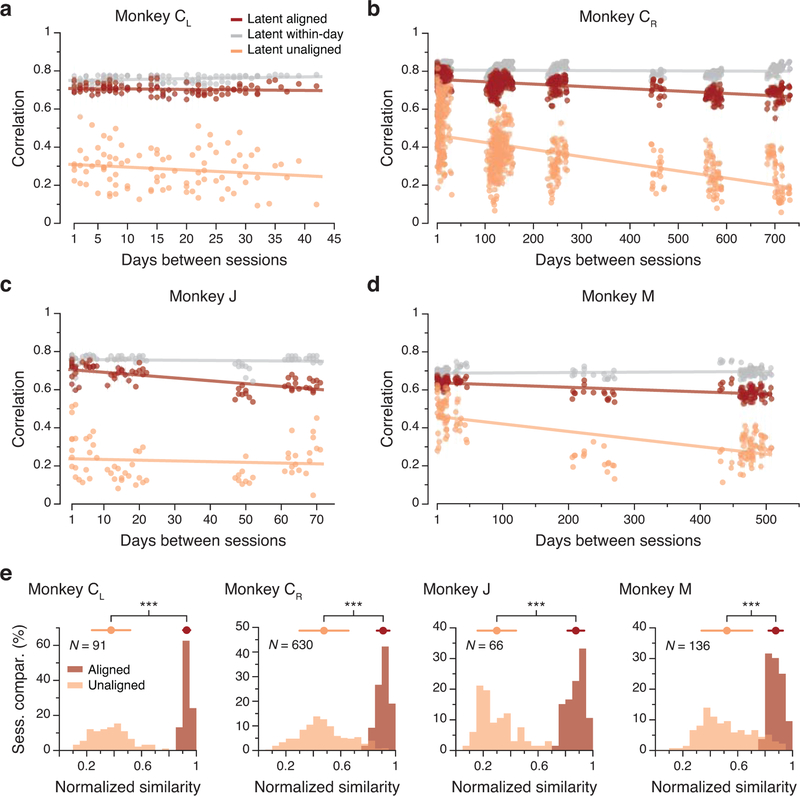
Stability of M1 latent dynamics over time. (a) Correlation of the aligned (CCs; red) and unaligned (Pearson’s r; orange) M1 latent dynamics averaged over the top four neural modes across all pairs of days from Monkey CL (single dots: pairs of days; lines: linear fits). The aligned latent dynamics maintained a higher correlation across days than the unaligned dynamics, and were almost as correlated across different days as the latent dynamics across different blocks of trials from the same day (gray). (b)-(d) Same as (a) for the other three M1 implants. (e) Normalized similarity of the aligned and unaligned across-days M1 latent dynamics during movement execution for each monkey (each shown in a different panel). The mean normalized similarity of the aligned latent dynamics across different days is close to 1; this indicates that their canonical correlations are almost as strong as the canonical correlations of the latent dynamics across two blocks of trials from the same day. *** indicates P < 0.001, two-sided Wilcoxon rank-sum test. Error bars: mean ± s.d. N: number of across-day comparisons.

