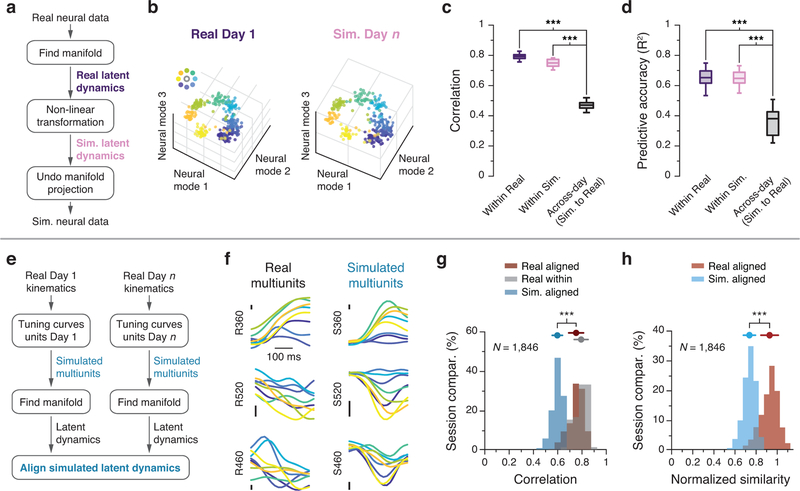
Figure 6.
Control analyses establish the importance of latent dynamics. (a) We created surrogate population activity by applying a nonlinear transformation to the latent dynamics of the recorded neural data and projecting them back onto the neural space (see Methods). (b) Both real and surrogate population activity exhibited target-specific clustering within the manifold. Each point represents the average activity during a reach in one session from Monkey CL. (c) Across all sessions from Monkey CL, CCs between the populations (black) were lower than CCs within the real (dark purple) and surrogate (light purple) populations. Box plots show median and 25th/75th percentiles, whiskers show range. N=14 sessions. (d) Decoders trained using real population activity performed poorly on the surrogate dataset, even after alignment. (e) We simulated population activity on two different days by passing movement kinematics of each day through tuning curves fit to the neural data of that day. (f) Example firing rates aligned to movement onset for real and simulated multiunit activity. Traces are colored by target as in (b). Vertical scale bar: 2 Hz. (g) Across all sessions from all M1 implants, canonical correlations between simulated latent dynamics (blue) were lower than those obtained from the actual latent dynamics from the same two days (red); the within-day CCs (gray) provide an upper bound. (h) Normalized similarity of the real latent dynamics (red) and of the simulated latent dynamics (blue). *** indicates P < 0.001, two-sided Wilcoxon rank-sum test. Error bars: mean ± s.d. N: number of simulated-to-real comparisons.

