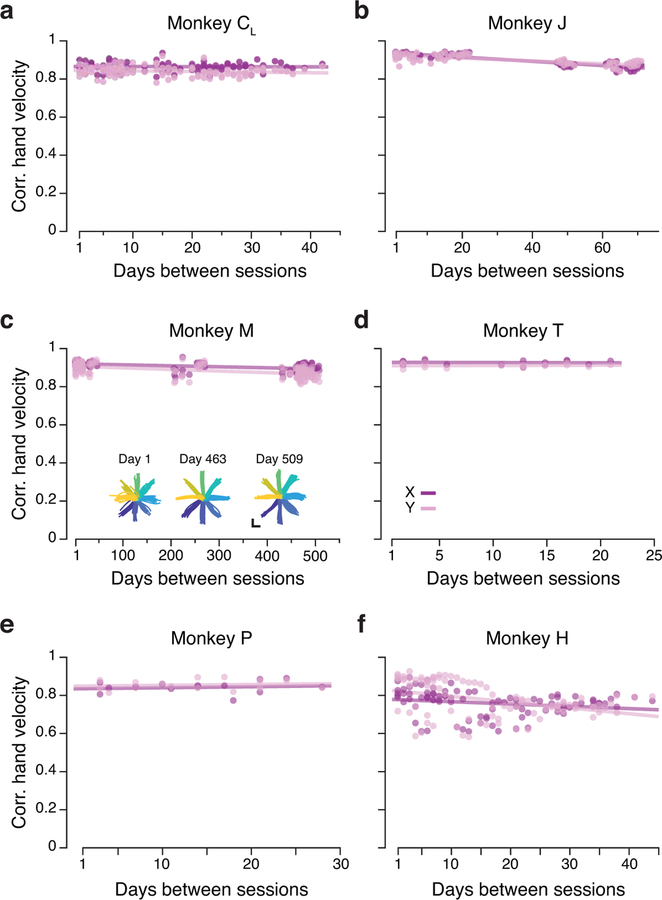
Extended Data Fig. 1. Additional data: task description and consistent behavior.
(a-f) Correlation between direction-matched single trial X and Y hand velocities across all pairs of days (single dots: individual trials; lines: linear fits) from Monkey CL (a), Monkey J (b), Monkey M (c), Monkey T (d), Monkey P (e), and Monkey H (f). The inset in (a) shows X and Y hand trajectories for three example sessions. Trajectories are color coded by target as in Figure 2.

