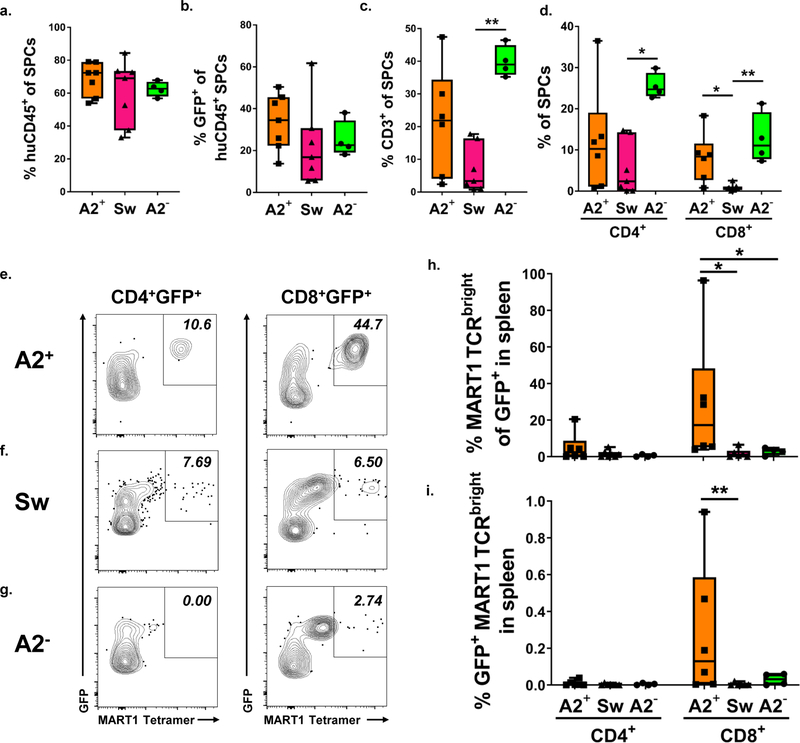
Figure 4: MART1 TCRbright T cells are reduced in the spleens of mice transplanted with A2− or swine compared to A2+ thymus. a-d.
Quantification of spleen chimerism, analyzed 10–14 weeks post-transplant, including a. proportions of huCD45+ cells among total CD45+, b. percentages of GFP+ cells within huCD45+ cells, and c. proportions of CD3+ and d. CD4+CD3+ and CD8+CD3+ splenocytes (SPCs), respectively. * = p < 0.05, ** = p < 0.01 by the Kruskal-Wallis test using Dunn’s correction for multiple comparisons. Representative FCM staining of spleens of mice transplanted with MART1 TCR-transduced cells and cotransplanted with either e. human HLA-A2+, f. swine or g. human HLA-A2− thymus, showing MART1 tetramer staining of huCD45+CD3+ CD4+ or CD8+GFP+ gated cells. Percent of MART1 TCRbright cells among h. CD4+GFP+ and CD8+GFP+ T cells and among i. splenocytes. * = p < 0.05, ** = p < 0 .01 by the Mann-Whitney U test. Data are from A2+ n = 6, Sw n = 5 and A2− n = 4 recipient mice, respectively.

