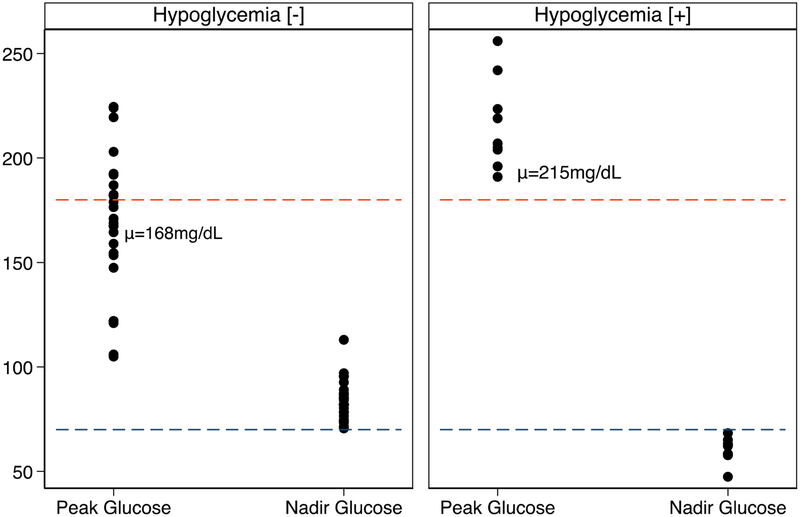
Figure 1:
(Left) Peak plasma glucose and glucose nadir for hypoglycemia [−] subjects. (Right) Peak plasma glucose and glucose nadir for hypoglycemia [+] subjects. Peak plasma glucose was higher in the hypoglycemia [+] group (215±21 vs 168±33 mg/dL, p<0.01) and glucose nadir was lower in the hypoglycemia [+] group (60±6 vs 84±9 mg/dL, p<0.01). Red dashed line represents plasma glucose of 180mg/dL and blue dashed line represents plasma glucose of 70mg/dL.

