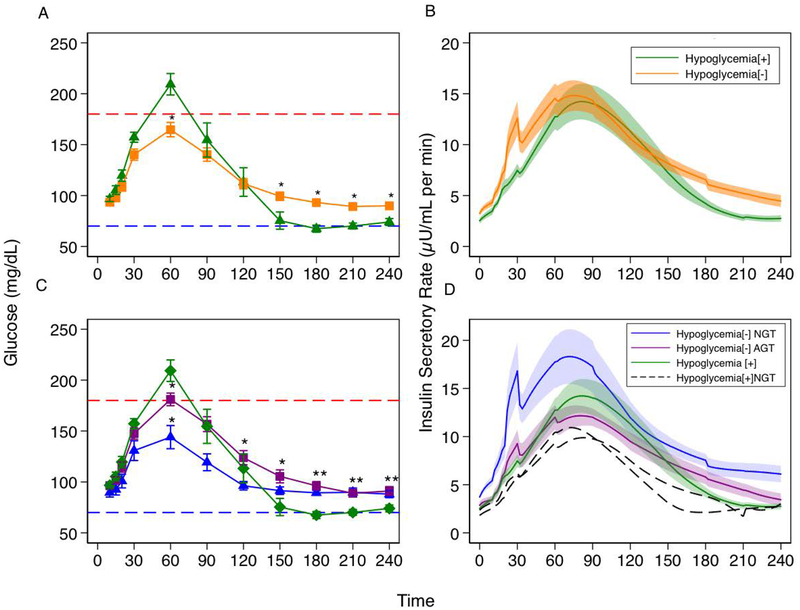
Figure 2:
A) Plasma glucose (mg/dL) following MMTT in hypoglycemia [+] vs hypoglycemia [−] groups. B) Insulin secretory rate (μU/mL per min) in response to MMTT. Early phase insulin secretion is blunted in hypoglycemia [+] vs hypoglycemia [−](p=0.03). C) Plasma glucose (mg/dL) following MMTT. Hypoglycemia [+] subjects have higher plasma glucose at 60 minutes (p=0.004). but declines in glucose through 120 to 180 minutes of testing unlike NGT subjects whose blood glucose values stabilize at 120 minutes. Accordingly, glucose AUC120–180 min was lower in the hypoglycemia [+] group (p= 0.015). D) Insulin secretory rate (μU/mL per min) in response to MMTT. Significant blunting of early phase insulin secretion is demonstrated in both hypoglycemia [−] AGT (purple) and hypoglycemia [+] (green) groups. Black dashed lines represent the Insulin secretory rates (μU/mL per min) for the 2 NGT-hypoglycemia [+] subjects. These subjects demonstrate loss of early phase insulin secretion despite normal glucose tolerance. After adjusting for glucose AUC over this interval, hypoglycemia [+] tended to have higher late insulin secretion than hypoglycemia [−] AGT (p=0.1).
Markers indicate mean value at that time point while bars indicate standard error of the mean. Black dashed lines are absolute insulin secretory rate for each of the two NGT-hypoglycemia [+] subjects. Red dashed line represents plasma glucose of 180mg/dL and blue dashed line represents plasma glucose of 70mg/dL. * indicates p-value <0.05 for that group’s glucose value compared with the hypoglycemia [+] group.

