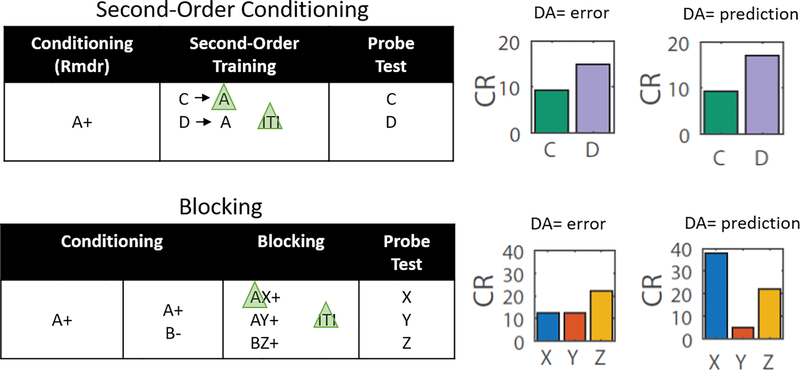
Figure 1: Modeling Results.
Experimental designs for second-order conditioning (top row) and blocking (bottom row), along with bar graphs modeling the predicted results of shunting of the dopamine transient at the start of the reward-predictive cue, A, in each procedure. Green triangles indicate light delivery to shunt dopamine transients at the start of the cue in TH-Cre rats expressing halorhodopsin in VTA neurons. The left column of bar graphs shows modeled results under the hypothesis that the cue-evoked dopamine transient signals a prediction error; the right column shows them under the hypothesis that it signals a reward prediction. Elimination of either signal would impair second-order conditioning (top graphs, C versus D), but only elimination of a prediction would affect blocking (bottom graphs, X vs Y/Z). Note the output of the classic TDRL model was converted from V to conditioned responding (CR) to better reflect the behavioral output actually measured in our experiments (see methods for details). See Extended Data Fig. 1 for modeling of behavior in the full experiments, culminating in these displays.

