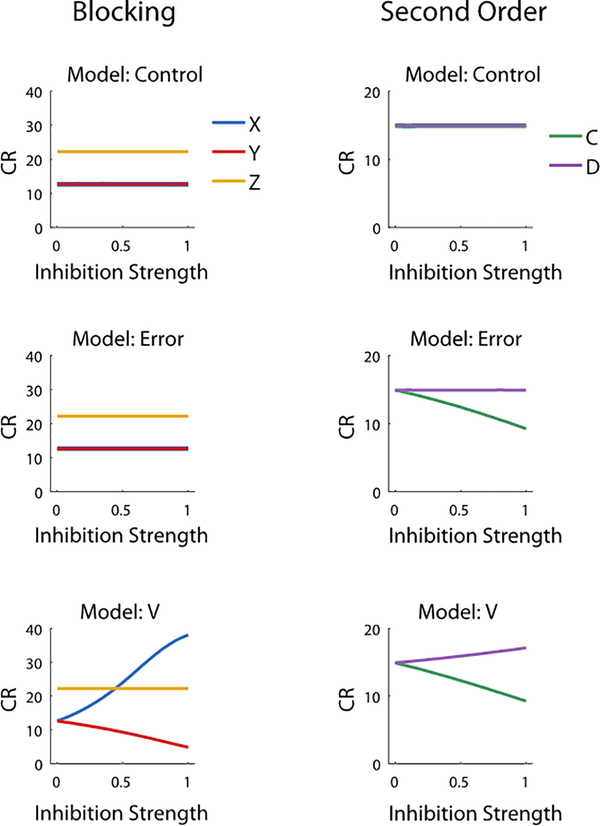
Extended Data Fig 4.
The modeling data show how different inhibition strength (i.e., η = 0, 0.5, 1 as used in the models, see also Figure S1) affects the predicted conditioned responding on Probe Test across the different models. Model Control represents eYFP controls in which inhibition is not effective. Model Error represents the dopamine signal acting as a prediction-error in which increases in inhibition strength do not affect conditioned responding to X in blocking but lead to reduced conditioned respdoning to the C in second-order conditioning. Model V represents the dopamine signal as prediction in which increases in inhibition strength lead to greater conditioned responding to X in blocking (i.e., unblocking) and reduced conditioned responding to C in second-order conditioning.

