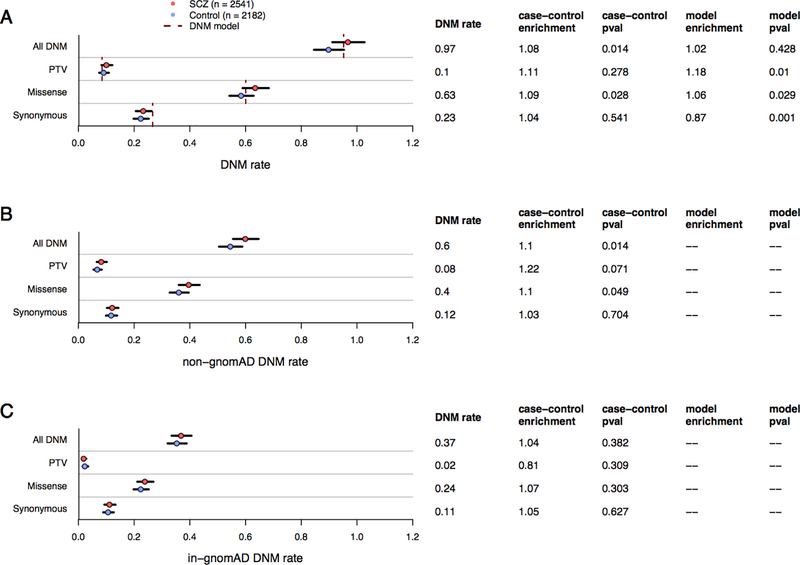
Figure 1:
DNM rates (dots), 95% CI (error bars), and DNM model expectations (dotted lines) among SCZ and control probands. Figure 1A: Exome-wide DNM rates split by primary annotation, where “All DNM” encompasses protein-truncating variants (PTV), missense, and synonymous DNMs. Poisson rate p-values (all two-sided and unadjusted) and rate enrichment compared to controls are listed to the right of the DNM rate. DNM rates split by the absence (Figure 1B) or presence (Figure 1C) of an extant allele at the same position in the 104k non-psychiatric gnomAD cohort.

