Figure 5.
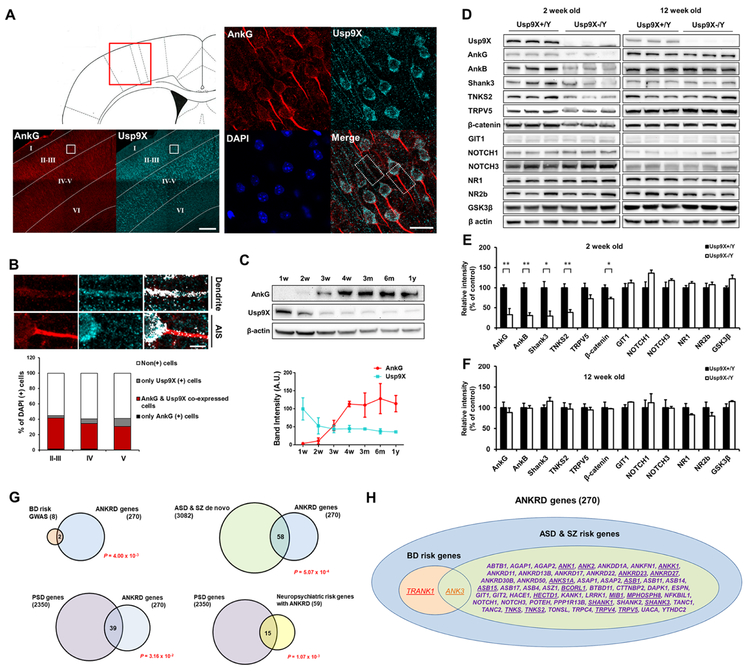
Impaired Usp9X function destabilizes ANKRD proteins. (A) Staining in the primary somatosensory cortex of 12-week old mouse brain; magnified layer II-III is zoomed in to cell level. Scale bar, 200 μm (left); 20 μm (middle); 5 μm (right). (B) The fraction of ankyrin-G or Usp9X-positive cells and quantification (n = 3) in each layer of the cortex. The graph is shown with mean values. (C) Protein levels of ankyrin-G and Usp9X in mouse cortex throughout lifespan. Representative Western blots in mouse cortex at various time periods (n = 3 for each group). (D) Levels of ANKRD and other synaptic proteins in cortex of 2- and 12-week old Usp9X+/Y or Usp9X−/Y mice. (E, F) Relative abundance of proteins in (D) (Usp9X+/Y, n = 4 and Usp9X−/Y, n = 3 in 2 weeks old; Usp9X+/Y, n = 4 and Usp9X−/Y, n = 4 in 12 weeks old). *p < 0.05; **p < 0.01; Two-tailed unpaired t-test was performed. (G) Enrichment of BD risk factors identified through GWAS (top left), de novo ASD/SZ risk factors (top right) and PSD proteins (bottom) among ANKRD proteins (n = 270); statistical significance is in red. (H) Diagram of neuropsychiatric risk genes encoding ANKRD proteins; underlined genes contain Ub-lysine sites within ANKRD. All data are represented as mean ± SEM. See also Figure S6.

