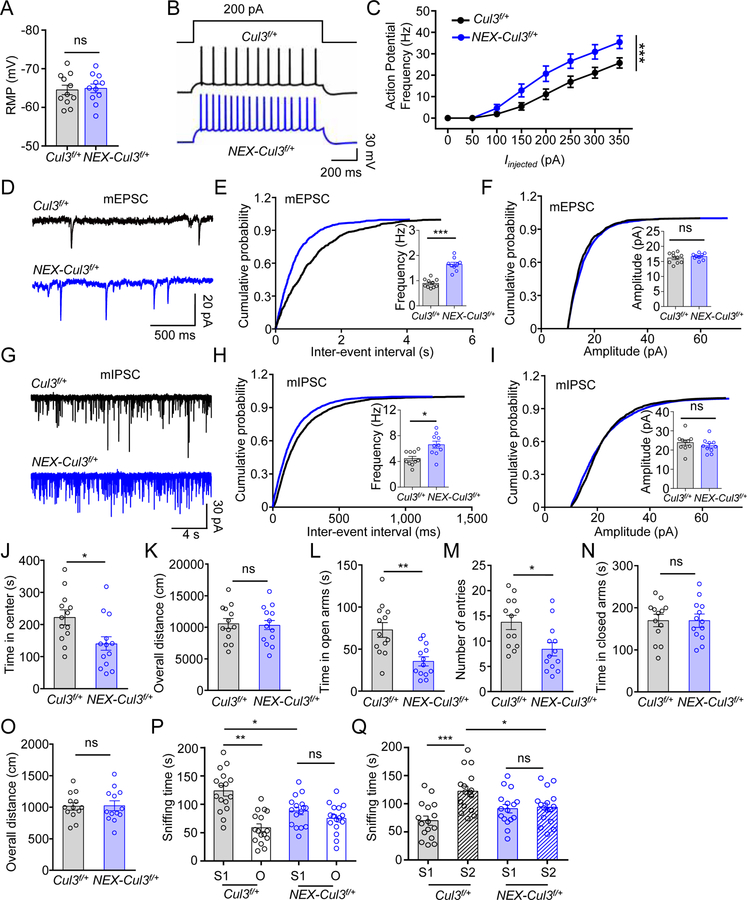
Figure 3. Similar neurotransmission and behavior deficits in adult NEX-Cul3f/+ mice.
(A) Comparable resting membrane potentials of CA1 pyramidal neurons. n = 11 neurons, 3 mice for both genotypes; control (−64.5 ± 1.8 mV) vs NEX-Cul3f/+ (−64.9 ± 1.6 mV), p = 0.7969; U = 56; Mann-Whitney test.
(B) Representative traces of spikes evoked by injecting depolarizing currents.
(C) Firing rates plotted against increasing injected currents. n = 10 neurons, 3 mice for Cul3f/+ group; n = 9 neurons, 3 mice for NEX-Cul3f/+ group; p < 0.0001; F(1, 136) = 28.76; Two-way ANOVA.
(D) Representative mEPSC traces.
(E) Increased mEPSC frequency. n = 10 neurons, 3 mice for Cul3f/+ group; n = 9 neurons, 3 mice for NEX-Cul3f/+ group; control (0.9 ± 0.06 Hz) vs NEX-Cul3f/+ (1.6 ± 0.1 Hz), p < 0.0001; U = 0; Mann-Whitney test.
(F) No difference in mEPSC amplitude. n = 10 neurons, 3 mice for Cul3f/+ group; n = 9 neurons, 3 mice for NEX-Cul3f/+ group; control (16.1 ± 0.6 pA) vs NEX-Cul3f/+ (16.6 ± 0.4 pA), p = 0.5490; U = 37; Mann-Whitney test.
(G) Representative mIPSC traces.
(H) Increased mIPSC frequency. n = 10 neurons, 3 mice for both genotypes; control (4.4 ± 0.4 Hz) vs NEX-Cul3f/+ (6.6 ± 0.8 Hz), p = 0.0107; U = 17; Mann-Whitney test.
(I) No difference in mIPSC amplitude. n = 10 neurons, 3 mice for both genotypes; control (23.7 ± 1.8 pA) vs NEX-Cul3f/+ (22.3 ± 1.6 pA), p = 0.2710; U = 35; Mann-Whitney test.
(J) Reduced time spent in the center. n = 13 mice for each genotype; control (215 ± 22.4 s) vs NEX-Cul3f/+ (149 ± 30.2 s), p = 0.0140; U = 37; Mann-Whitney test.
(K) No difference in total distance traveled. n = 13 mice for each genotype; control (10700 ± 804 cm) vs NEX-Cul3f/+ (10300 ± 718 cm), p = 0.8403; U = 80; Mann-Whitney test.
(L) Reduced time in open arms. n = 13 mice for each genotype; control (74.2 ± 10.7 s) s) vs NEX-Cul3f/+ (34.8 ± 7.0 s), p = 0.0015; U = 25; Mann-Whitney test.
(M) Reduced entries into open arms. n = 13 mice for each genotype; control (14.2 ± 1.8) vs NEX-Cul3f/+ (8.8 ± 1.8), p = 0.0081; U = 34; Mann-Whitney test.
(N) No difference in time spent in closed arms. n = 13 mice for each genotype; control (167 ± 19.6 s) vs NEX-Cul3f/+ (182 ± 17 s), p = 0.8910; U = 81.5; Mann-Whitney test.
(O) No difference in total distance traveled. n = 13 mice for each genotype; control (1030 ± 86.5 cm) vs NEX-Cul3f/+ (1010 ± 241 cm), p = 0.6958; U = 76.5; Mann-Whitney test.
(P) Reduced sniffing time with a novel mouse (S1) in NEX-Cul3f/+ mice than control mice. n = 16 mice per each group; control S1 (122 ± 9.2 s) vs control O (58.5 ± 6.9 s), p < 0.001; control S1 vs NEX-Cul3f/+ S1 (88.3 ± 6.6 s), p = 0.012; NEX-Cul3f/+ S1 vs NEX-Cul3f/+ O (75.2 ± 6.4 s), p > 0.999; F(1, 60) = 27.11; Two-way ANOVA followed by Bonferroni’s post hoc test.
(Q) Reduced sniffing time with a stranger mouse (S2) in NEX-Cul3f/+ mice than control mice. n = 16 mice per each group; control S1 (69.9 ± 8.2 s) vs control S2 (122 ± 9.0 s), p < 0.001; control S2 vs NEX-Cul3f/+ S2 (93.7 ± 7.5 s), p = 0.032; NEX-Cul3f/+ S1 (91.2 ± 7.5 s) vs NEX-Cul3f/+ S2, p > 0.999; F(1, 60) = 11.56; Two-way ANOVA followed by Bonferroni’s post hoc test.
Data were shown as mean ± SEM. *p < 0.05, **p < 0.01, ***p < 0.001; ns, no significant difference.

