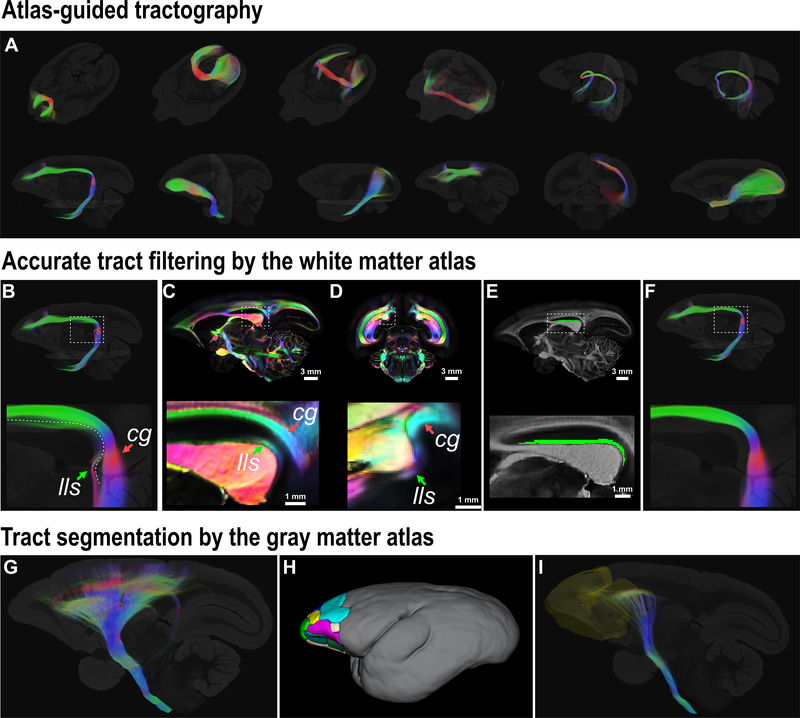
Figure 7. Atlas-guided dMRI tractography.
(A) Several major pathways reconstructed by atlas-guided tractography are presented. From left-to-right and top-to-bottom are: the forceps minor; the forceps major; the inferior forceps; the anterior commissure; the circuit tract connecting hippocampus of two hemispheres via the vhc; the hippocampus-fornix-mammillary bodies circuit; the cingulum; the uncinate fasciculus; the inferior longitudinal fasciculus; the occipitofrontal fasciculus; the occipital vertical fasciculus; the optic tract - LGN - optic radiation circuit tract. (B-F) An example of accurate filtering by the atlas. (B) shows the reconstructed cingulum (cg) that is contaminated by the lateral longitudinal striae (lls); (C-D) shows the cg and lls on a sagittal slice and a coronal slice (80 μm), respectively. (E) shows the ROI of the lls from the atlas on a sagittal slice. (F) shows the filtered cg in which the lls is removed by using the atlas. (G-I) shows an example of a tract segmentation by the cortical atlas. (G) shows the reconstructed projection fibers via the internal capsule. (H) shows the frontal cortical regions of the cortical atlas (ROIs 1–16 of the MRI-based 54-area cortical parcellations in our atlas16, Supplementary Table 2). (I) shows the frontopontine fibers from the projection fibers in (G) by using the frontal cortical ROIs in (H) as the filtering mask.

