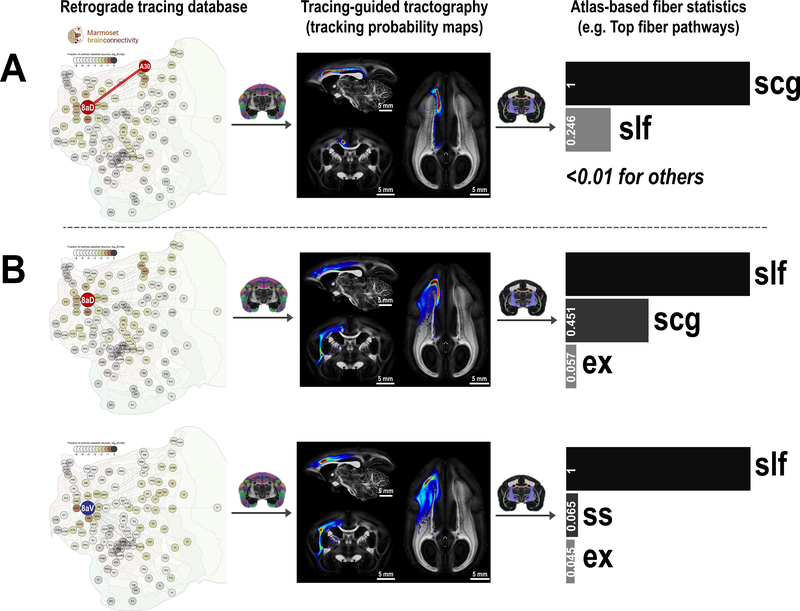
Figure 8. Fiber-pathway profiles of cortical connections and regions.
(A) Fiber pathway of a connection (e.g., the connection between A8aD and A30). The tracing database (Marmoset Brain Connectivity Atlas) provides information about which regions are connected (first column). Probabilistic tractography between two connected regions generates a tracking probability map (second column). By ranking the probability map with our white matter atlas, we estimate the fiber pathway supporting the connection (third column). (B) Fiber pathway profiles of a cortical region (A8aD and A8aV). All tracking maps of one region are averaged and then ranked by the white matter atlas to estimate the fiber pathway profiles of the region. All fiber profiles are scaled so that the top-ranking fiber pathway has a value of 1. slf: superior longitudinal fasciculus; scg: superior cingulum; ex: external capsule; ss: sagittal stratum.

