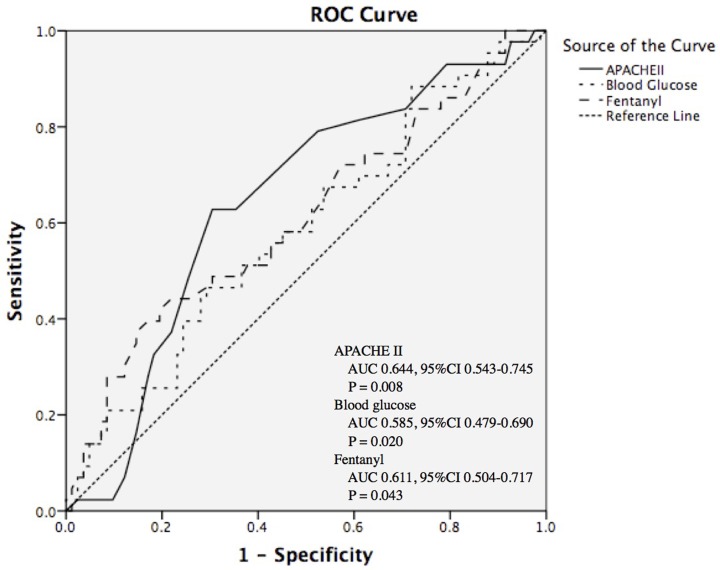
Figure 2. ROC curves of APACHE II, blood glucose, and fentanyl at the time of extubation in distinguishing extubation failure in patients with severe pneumonia.
APACHE II, acute physiology and chronic healthy evaluation II; AUC, area under the curve; CI, confidence interval; ROC, receiver operating curve.

