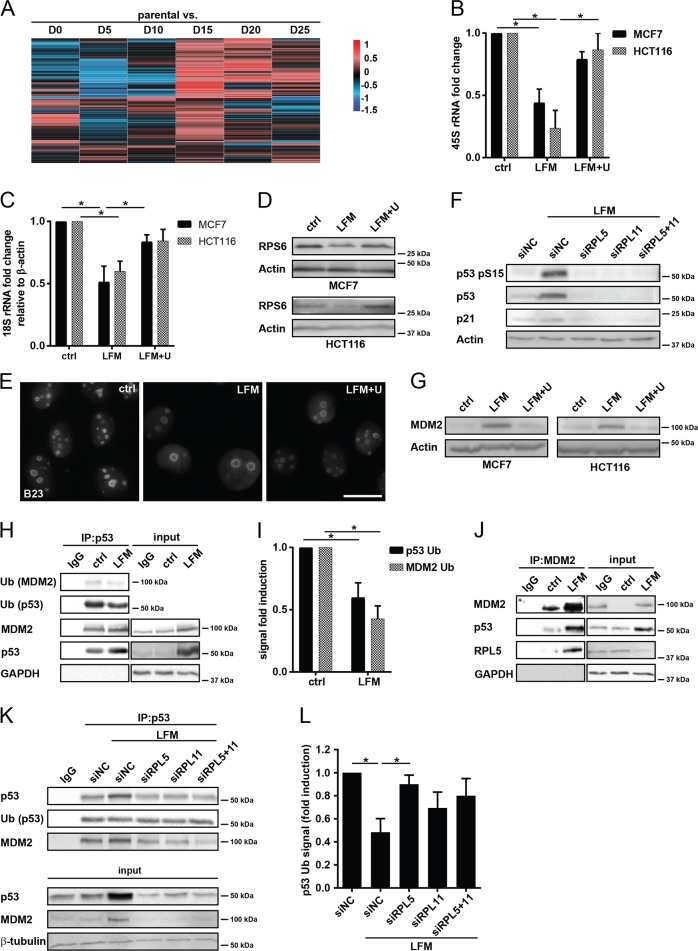
Fig. 2. Inhibition of DHODH stabilizes the p53 tumor suppressor protein.
a Parental 4T1 cells and D0–D25 sublines were subjected to microchip analysis and a heat map for the 119 transcripts involved in ribosome biogenesis was constructed. b–e, g MCF7 and HCT116 cells were exposed to leflunomide (LFM, 50 µM) for 72 h in the presence or absence of uridine (U; 50 µg/l). Expression of 45S rRNA (b) and 18S rRNA (c) was assessed by qRT-PCR. d Immunoblotting detection of RPS6 was performed. β-Actin was used as a loading control. e Immunofluorescent detection of B23 in MCF7 cells was performed. f Immunoblotting detection of p53 pS15, p53, and p21 in MCF7 cells treated 72 h with LFM (50 µM) after downregulation of RPL5 and RPL11 alone or in combination using specific siRNA. Non-targeting siRNA (siNC) was used as a control. β-Actin was used as a loading control. g Immunoblot detection of MDM2 in MCF7 and HCT116 cells. β-Actin was used as a loading control. h Co-immunoprecipitation of p53 followed by immunoblot analysis of p53, MDM2, ubiquitinated p53, and ubiquitinated MDM2 in MCF7 control and LFM (50 µM, 72 h)-treated cells. GAPDH was used as an input control. Immunoprecipitated samples and input represent one membrane with different intensity of signal. i Levels of ubiquitinated p53 and MDM2 related to their immunoprecipitated total forms were evaluated from three independent experiments. j Co-immunoprecipitation of MDM2 followed by immunoblot analysis of MDM2, p53, and RPL5 protein in MCF7 control and LFM (50 µM, 72 h)-treated cells. GAPDH was used as an input control. Immunoprecipitated samples and input represent one membrane with different intensity of signal. k Co-immunoprecipitation of p53 followed by immunoblot analysis of total and ubiquitinated p53 and MDM2 in MCF7 cells treated with LFM (50 µM, 72 h) after downregulation of RPL5 and RPL11 alone or in combination using specific siRNA. Non-targeting siRNA (siNC) was used as a control. p53, MDM2, and β-tubulin were used as an input control. l The level of ubiquitinated p53 related to its immunoprecipitated total form was evaluated from three independent experiments. In b, c, i, and l, data are shown as mean ± SEM, n = 3. *P < 0.05, two-way ANOVA. In other panels, representative experiment (from total number of three experiments) is shown.

