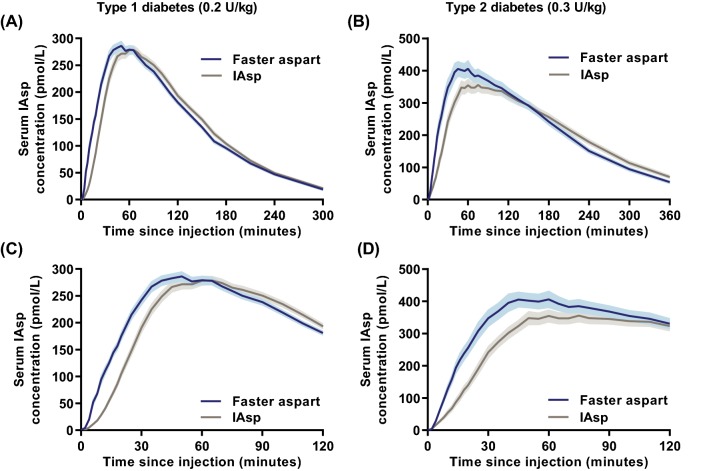
Fig. 2.
Pharmacokinetic profiles for faster aspart versus IAsp in subjects with T1D and T2D. Mean 5-h (a), 6-h (b) or 2-h (c, d) serum IAsp concentration–time profiles after a subcutaneous dose of 0.2 U/kg in T1D (a, c) and 0.3 U/kg in T2D (b, d). Variability bands show the standard error of the mean. IAsp insulin aspart, T1D type 1 diabetes, T2D type 2 diabetes, U units. Modified from Heise et al. [16] under the terms of the Creative Commons Attribution-NonCommercial 4.0 International License (http://creativecommons.org/licenses/by-nc/4.0/) and from Pieber et al. [17]

