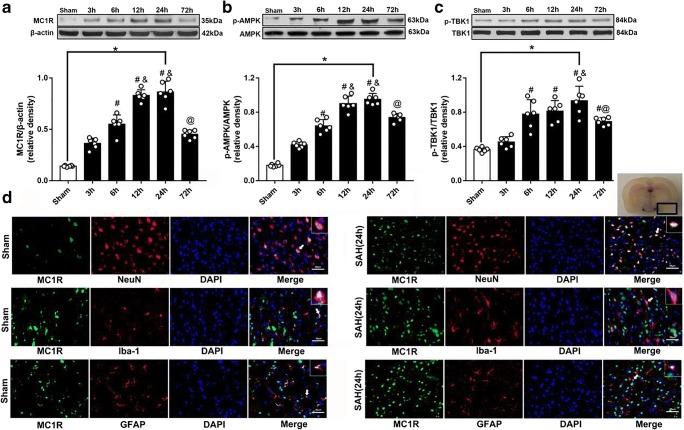
Fig. 2.
Expression of MC1R, p-AMPK and p-TBK1. Representative Western blot images and quantitative analyses of MC1R time course (A), p-AMPK time course (B), and p-TBK1 time course (C) obtained from the left hemisphere after SAH; N=6 for each group. Data of comparison between sham and SAH (24 h) are shown as mean ± SD and compared by using T-test. Other data are shown as mean ± SD and compared by one-way ANOVA followed by the Tukey post hoc test. *p<0.05 versus sham, #p<0.05 versus SAH (3 h), &p<0.05 versus SAH (6 h), @p<0.05 versus SAH (24 h); (D) Representative microphotographs of immunofluorescence staining showing localization of APJ (green) with NeuN, iba-1 and GFAP (red) 24 h in sham group and SAH (24 h) group. (N=2 for each group). Scale bar=50μm.

