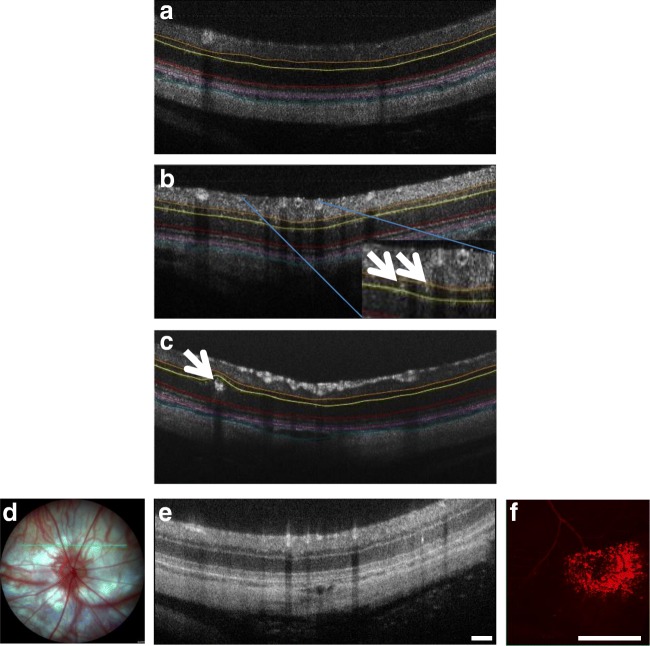
Fig. 7.
Representative OCT images of the hyperglycemic rats showing an average of 5–8 hyper-reflective spots per eye (based upon 7 evenly spaced OCT scans across the retina and therefore an underestimate for the whole eye), but none in normal SD rats (a). The hyper-reflective spots appeared to be microaneurysms (less than 20-μm diameter; arrows in b) and macroaneurysms (140–160 μm; arrow in c) and they were located specifically in the INL and ONL. The colored lines on the OCT images highlight the INL (orange to yellow), the ONL (yellow to red), the choroid (purple to cyanin). Evans Blue dye perfusion confirmed blood vessel leakage at sites of the aneurysms mapped using OCT. The green line on the fundus image (d) shows in which location the OCT scan (e) was taken. The hyper-reflective spot (arrow) is a microaneurysm. The rats were injected with Evans Blue and the retina was then removed and imaged in that region revealing a region of vessel leak (f). Leakage was not associated with all microaneurysms but blood vessel leakage was consistently seen in four hyperglycemic rats with microaneurysms. Scale bar = 100 μm

