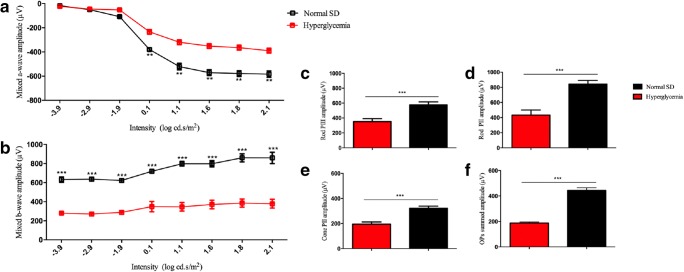
Fig. 8.
ERG analysis of hyperglycemic retina function 5 weeks after birth compared with normal SD rats from which the hyperglycemic strain was derived. Representative ERG mixed a- and b- waveforms are shown in a, b. The average mixed a-wave amplitude was significantly reduced in hyperglycemic rats compared to normal SD rats. Mixed b-wave amplitude was also significantly reduced in hyperglycemic rats, with normal SD rats. Breakdown analysis shows amplitudes were significantly reduced in the hyperglycemic rats for rod PIII (c), PII (d), cone PII (e) responses and for OPs compared with the control group (f). Statistical analysis was conducted using one-way ANOVA, followed by Tukey’s multiple comparisons test. Significant values in comparison with normal SD are indicated with asterisks: *p < 0.05; **p < 0.01; ***p < 0.001. OP = oscillatory potentials

