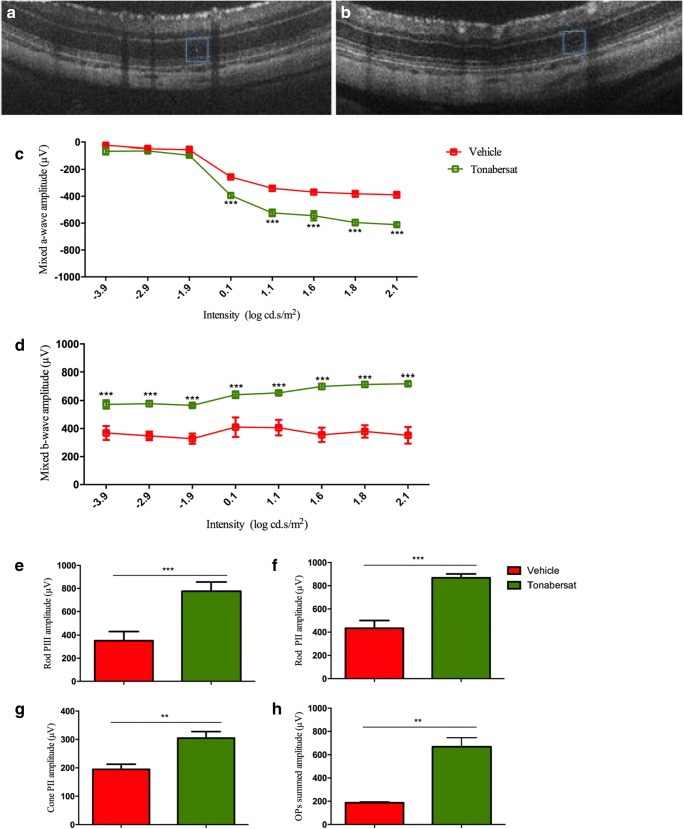
Fig. 9.
OCT and ERG analysis of hyperglycemic rat retinal structure and function at 8 weeks (at the lowest dose used, 0.28 mg/kg) once daily for 14 days (weeks 5–7) compared with vehicle-treated animals. (a) A hyper-reflective spot that is barely visible after treatment (b). ERG had significantly recovered in treated hyperglycemic rats compared with vehicle-treated rats, whereas untreated rats had deteriorated further from week 5 to 8. In treated animals, mixed a-wave was significantly higher compared to vehicle-treated animals at 8 week (c). Similarly, mixed b-wave had significantly recovered in the tonabersat-treated animals for all intensities, compared to vehicle control group (d). Further analysis revealed that treated hyperglycemic rats had significantly recovered rod PIII (e), PII (f), cone PII (g), and summed OPs (h) amplitudes. Statistical analysis was conducted using one-way ANOVA, followed by Tukey’s multiple comparisons test. Significant values in comparison with vehicle treatment are indicated with asterisks: *p < 0.05; **p < 0.01; ***p < 0.001. OP = oscillatory potentials. Scale bar = 100 μm

