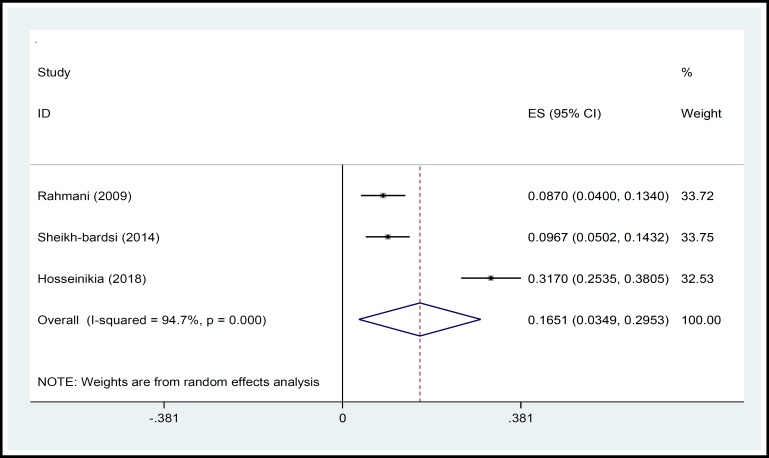
Figure 4.
Forest Plot Shows the Prevalence Rate of Cultural WPV in Overall and Separately
The square sign shows the prevalence rate of cultural WPV for each study. Diamond sign at the bottom of the figure shows the overall prevalence rate of cultural WPV for all the studies. The diamond diameter also shows the 95 % confidence interval of the overall prevalence of cultural WPV.

