Fig. 1.
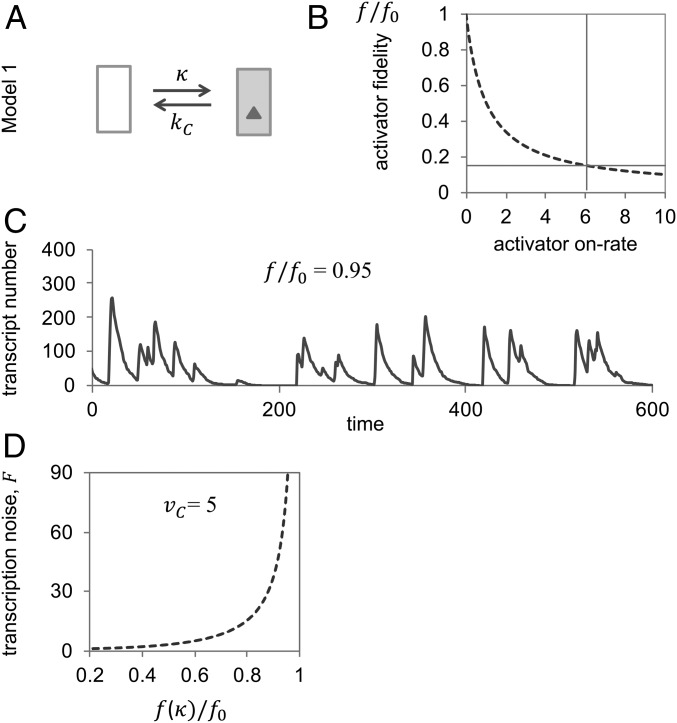
Standard two-state promoter model (Model 1): activator fidelity is bounded by the Hopfield barrier. (A) Transition graph of Model 1. (B) Activator fidelity approaches its upper limit or Hopfield barrier, , as the activator on rate, , tends to zero. To calculate the graph, we assumed , . Actual fidelities must be markedly lower than : for instance, measured off-rates for Pho4 of yeast (the activator of PHO5) for specific and nonspecific sequences are ∼0.01 and 1 s−1, respectively (7, 9). From Pho4’s equilibrium dissociation constant for correct binding of nM (9), and nuclear concentration of nM (47) (assuming a nuclear volume of 4 femtoliters), both the on-rate, (indicated by a vertical line), and relative fidelity (indicated by horizontal line) may be calculated; the unit on the abscissa, then, is . (C) Representative “sample path” (single cell trajectory of mRNA abundance) at relative activator fidelity of 0.95; the sample path was obtained with the Gillespie stochastic simulation algorithm (48) with , , (rate constant for mRNA degradation), and average rate of transcription, . (D) The Fano factor tends to infinity as activator fidelity, , approaches the Hopfield barrier . Calculations were based on the assumption of , , and average rate of transcription . Both Fano factor and fidelity were calculated as functions of the activator on-rate, κ (SI Appendix).

