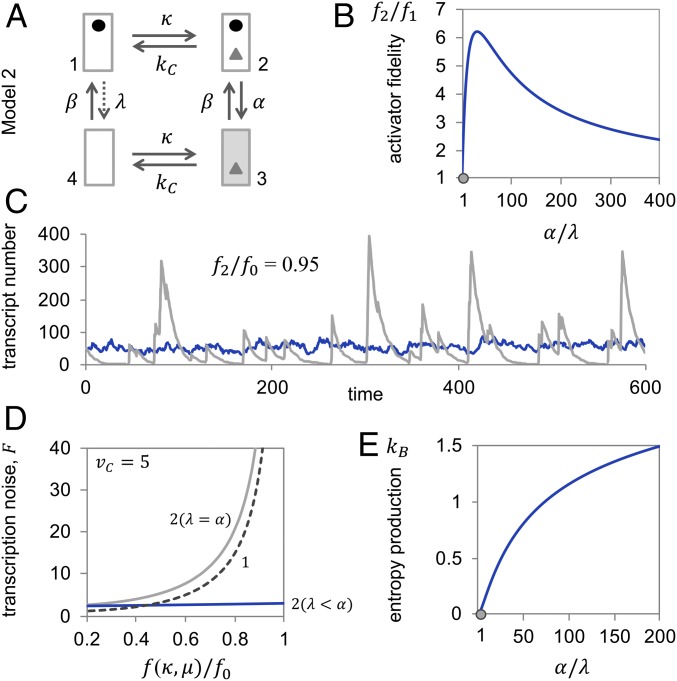
Fig. 2.
Nucleosome dynamics away from, but not in, equilibrium allow for increased activator fidelity and attenuation of transcription noise. (A) Transition graph of Model 2. (B) Activator fidelity of Model 2 normalized by the fidelity of Model 1 , as a function of the rate of nucleosome removal in the activator-bound state, , normalized by the rate of removal in the unbound state, . For calculations, we assumed , , , , and . The gray dot indicates the equilibrium state. (C) Representative sample paths at relative activator fidelity and for nonequilibrium nucleosome dynamics (dark gray; , ), which required and ; and equilibrium dynamics (light gray; ), which required and . For both simulations, we assumed . (D) Transcription noise as a function of relative activator fidelity, , for Model 2 in equilibrium (light gray, 2 [α = λ]; α, λ = 2), away from equilibrium (blue, 2 [α > λ]; , ), and Model 1 (dashed line, 1; same as in Fig. 1D). For all calculations, we assumed, as above, , , and . Fano factor and activator fidelity were calculated as functions of the activator on-rate, κ, and the rate of transcription in the active state, (SI Appendix). (E) Entropy production (in units of , the Boltzmann constant) as a function of nucleosome removal rate in the activator-bound state, , relative to the rate in the unbound state, , for , , and . The gray dot indicates the equilibrium state.

