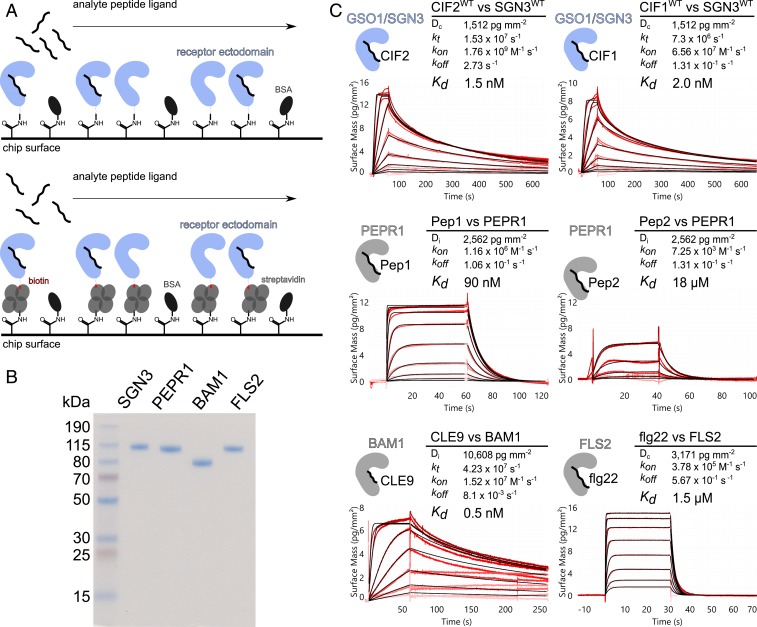
Fig. 1.
GSO1/SGN3–CIF2 represents one of the strongest LRR-RK peptide–ligand pairs in Arabidopsis. (A) Schematic overview of the GCI binding assay. (A, Top) For direct amine coupling, receptor ectodomains (in blue) were immobilized onto the GCI chip, followed by passivation and quenching of the surface with BSA (in dark gray). Peptide ligands (in black) were applied as analyte in different concentrations to derive binding kinetics. (A, Bottom) For Avi-tag based coupling, streptavidin (in gray) was immobilized using the same amine-coupling method as shown above. Next, the biotinylated ectodomain of the respective receptor was captured by streptavidin. (B) Purity of the recombinantly expressed and purified LRR-RK ectodomains used in the GCI experiments. Shown is a Coomassie-stained SDS/PAGE, 1 µg of the respective LRR ectodomain was loaded per lane. Purified proteins were isolated from monomeric peak fractions in size-exclusion chromatography experiments. (C) Quantitative comparison of GSO1/SGN3–CIF2 with other known LRR-RK peptide–ligand pairs by GCI. The flow rate was 100 µL min−1 on each channel, except for FLS2 where the flow rate was adjusted to 55 µL min−1. Shown are sensorgrams with raw data in red and their respective fits in black. Binding kinetics were analyzed by a 1-to-1 binding model with mass transport in the case of GSO1/SGN3–CIF1/2 and CLE9–BAM1; a 1-to-1 binding model was used for the remaining interactions. Table summaries of kinetic parameters are shown alongside (Dc/Di, density of captured/immobilized protein; kt, mass transport coefficient; kon, association rate constant; koff, dissociation rate constant; Kd, dissociation constant).

