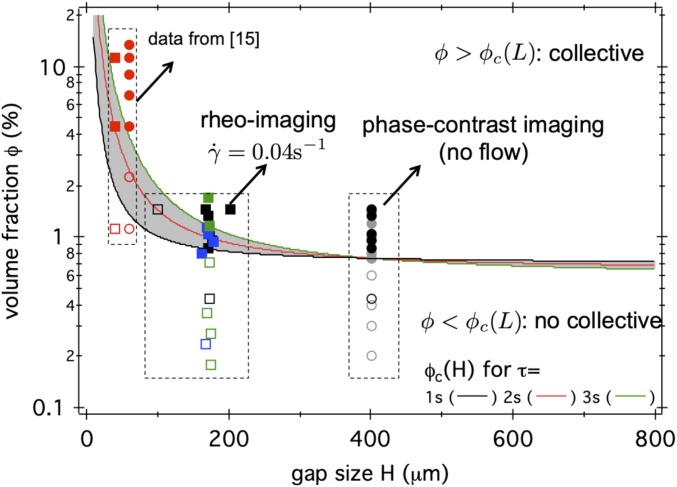
Fig. 1.
Confinement effect on flow stability and collective motion. Lines indicate calculated confined critical volume fraction , according to CKT using Eq. 4 and the experimentally measured (Fig. 4 I and J) as . defines the boundary between stable (below) and unstable (above) pusher suspensions for different persistence time of the swimmers, as indicated in the key, with speed . Symbols: experimental observation of flow with (filled squares) and without (open squares) banding; and with (filled circles) or without (open circles) large correlation length-scale , based on rheo-imaging (squares) and phase-contrast imaging (no flow; circles), respectively. See Fig. 4 and related main text for more details. Red: Data from ref. 15 at (an offset is applied to squares for better visualization).

