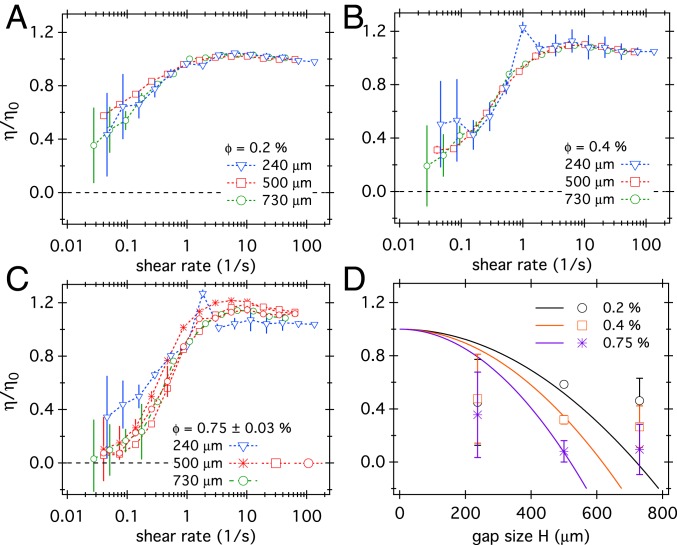
Fig. 3.
(A–C) The viscosity of E. coli suspensions as a function of shear rate, , at gap sizes , 500, and for (A), (B), and (C). (D) The measured viscosity at for three bacterial concentrations (symbols) compared to the predictions (color-matched) of ALCT (lines) using parameters from ref. 18 and a cell volume (34) and buffer viscosity .

