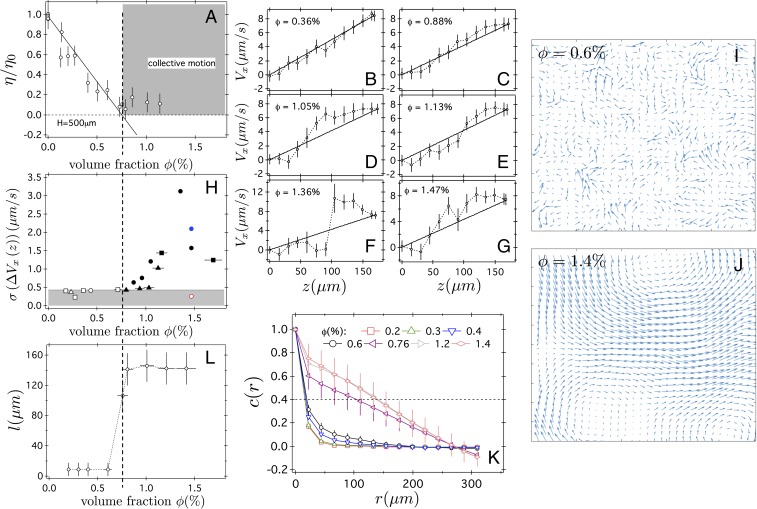
Fig. 4.
(A) The viscosity of E. coli suspensions measured with a gap at a shear rate , as a function of volume fraction, normalized to the viscosity of the buffer cP, with the concentration of serine in mM used to prepare the solutions. The gray area defines the presence of large-scale collective motion, observed above (vertical dashed line), as characterized in I–L. (B–G) Examples of velocity profiles measured by using rheoimaging in cone-plate geometry of bacterial suspensions at progressively higher volume fraction , as indicated, and for and . (H) SD of over the entire range, with the applied shear rate , as a function of volume fraction. Open and filled symbols indicate linear and nonlinear flow profile, respectively, for (red), (black; each symbol corresponds to an independent experimental campaign), and (blue). Gray area defines the linear flow range based on an arbitrary threshold of . (I and J) Examples of velocity vector fields from PIV at two below (I) and above (J) . Image width is . (K) Velocity correlation functions calculated from Eq. 5 and averaged over min at various measured via PIV analysis of phase-contrast microscopy movies of cell suspensions in sealed capillaries with . Error bars are 1 SD representative of the time dependency. (L) Characteristic length for which .

