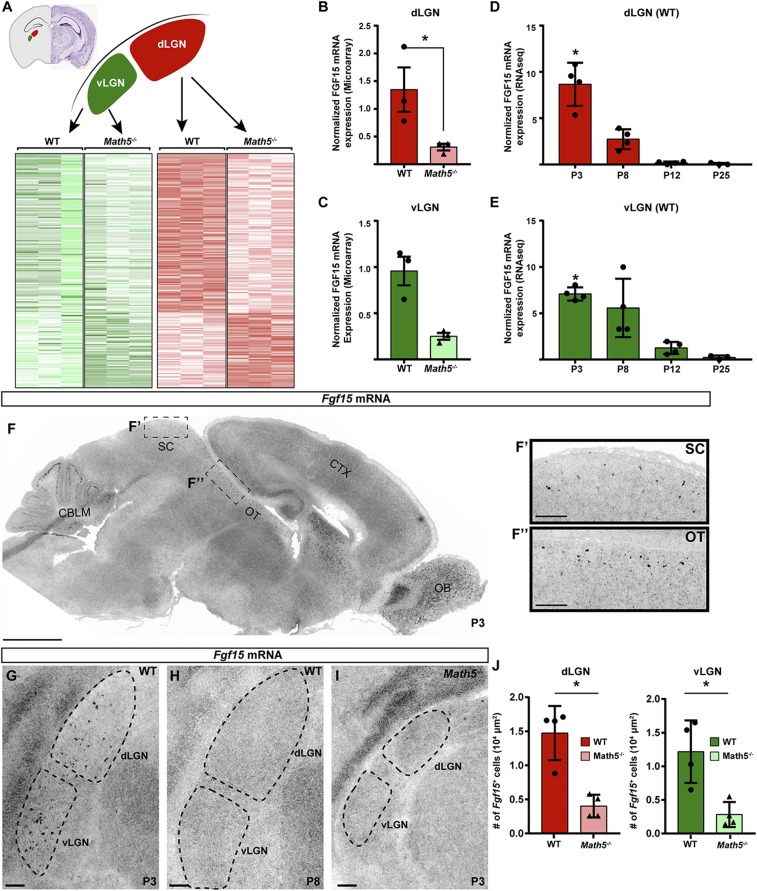
Fig. 3.
Fgf15 expression in the visual thalamus is dependent on retinal input. (A) Heat maps of differential gene expression in P2 WT and Math5−/− vLGN and dLGN assessed by Agilent microarrays (full dataset in ref. 29). (B and C) Microarray analysis revealed significant loss of Fgf15 mRNA expression in the dLGN (B) and vLGN (C) in P2 Math5−/− mutants. Bars represent means ± SEM, Asterisks (*) represent significance (P < 0.05) between by two-way ANOVA. (D and E) RNA-seq analysis revealed Fgf15 mRNA expression decreases postnatally in the WT dLGN (D) and vLGN (E). Bars represent means ± SEM. Asterisks (*) represent significantly enriched expression at P3 compared to P12 and P25 (P < 0.05) by two-way ANOVA. (F–H) ISH revealed Fgf15 mRNA expression in the SC, optic tract (OT), dLGN, and vLGN at P3 (G), but little to no expression at P8 (H). (I) ISH revealed significantly reduced Fgf15 mRNA expression in the visual thalamus in P3 Math5−/− mutants. (J) Fgf15+ cells were quantified in the dLGN and vLGN of P3 Math5−/− mutants and WT controls. Bars represent means ± SEM. Asterisks (*) represent significantly decreased (P < 0.01) expression in Math5−/− mutants compared to WT controls by Student’s t-test. (Scale bars, (F) 1,000 μm, all others 100 μm.)

