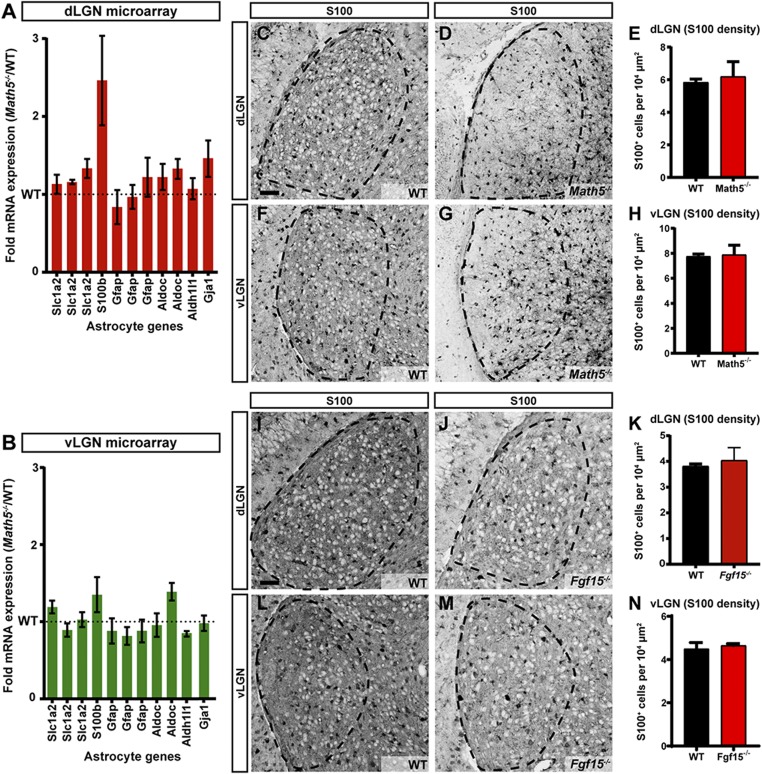
Fig. 8.
Loss of retinal input or Fgf15 does not impact the distribution of astrocytes in the visual thalamus. (A and B) Microarray dataset comparing the expression of several astrocytic markers between the P2 WT and Math5−/− mutant visual thalamus (29). Dashed line represents expression levels in WT. Data are shown as means ± SEM. (C and D) Immunostaining for the astrocytic marker S100 in the WT (C) and Math5−/− (D) dLGN (outlined with dashed lines). (E) Quantification of S100+ cells in the dLGN of WT and Math5−/− mice. Data are shown as means ± SEM. (F and G) Immunostaining for S100 in WT (F) and Math5−/− (G) vLGN (outlined with dashed lines). (H) Quantification of S100+ cells in the vLGN of WT and Math5−/− mice. Data are shown as means ± SEM. (I and J) Immunostaining for S100 in WT (I) and Fgf15−/− (J) dLGN (outlined with dashed lines). (K) Quantification of S100+ cells in the dLGN of WT and Fgf15−/− mice. Data are shown as means ± SEM (L and M) Immunostaining for S100 in WT (L) and Fgf15−/− (M) vLGN (outlined with dashed lines). (N) Quantification of S100+ cells in the vLGN of WT and Fgf15−/− mice. Data are shown as means ± SEM. (Scale bars, 50 µm for C–G; 70 µm for I–M.)

