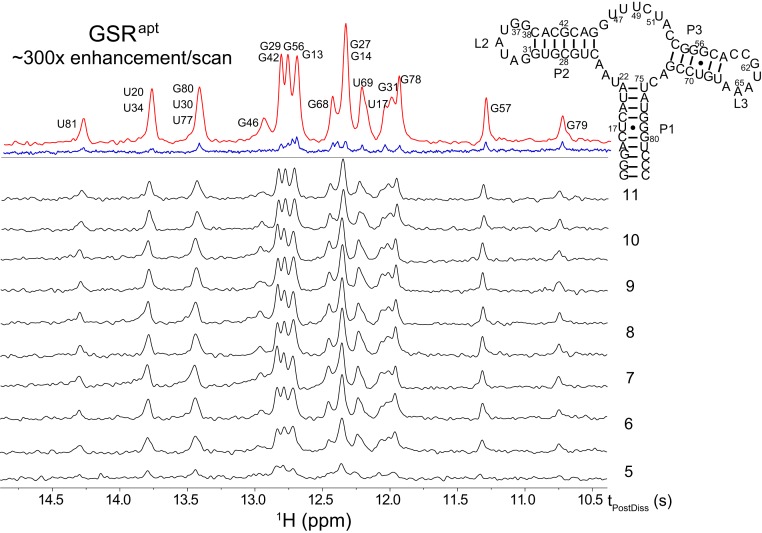
Fig. 1.
In black, 1D selective spin-echo single-shot spectra acquired using the sequence in SI Appendix, Fig. S1A, upon injection of HyperW at 37 °C into a nonlabeled GSRapt sample. The final concentration of RNA was ∼300 µM, and data were recorded with a time resolution of 0.685 s at the postdissolution times indicated on the right. These times represent the seconds elapsed after the water dissolution started and include the transfer to the magnet and a mixing period (notice how turbulence, still present in the first spectrum, affects the peaks’ intensities). The top trace in the figure compares the sum of the 10 HyperW spectra collected from 4.80 to 10.96 s (red), against a thermal spectrum acquired for the same sample using 2,048 fully relaxed transients (in blue). Shown above the traces is the aptamer’s secondary structure and its numbering, together with selective peak assignments.

