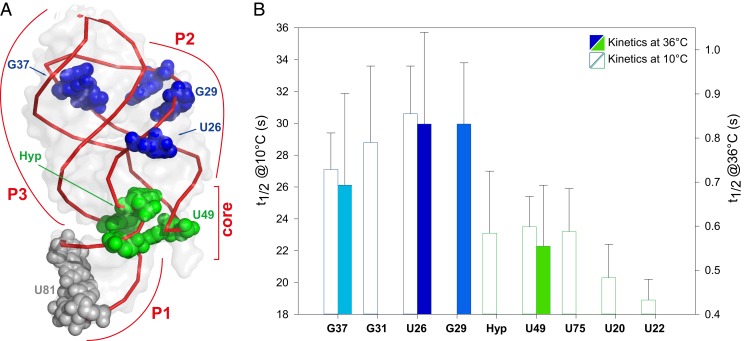
Fig. 4.
(A) Tertiary structure of the GSR aptamer, highlighting the bases experiencing faster ligand-binding kinetics (green), slower tertiary loop–loop rearrangement (blue), and no change (gray). (B) Histogram plots summarizing the half-life times extracted from the 36 °C HyperW measurements and from the kinetics measured at 10 °C by Buck et al. (24), highlighting the distinct kinetics observed.

