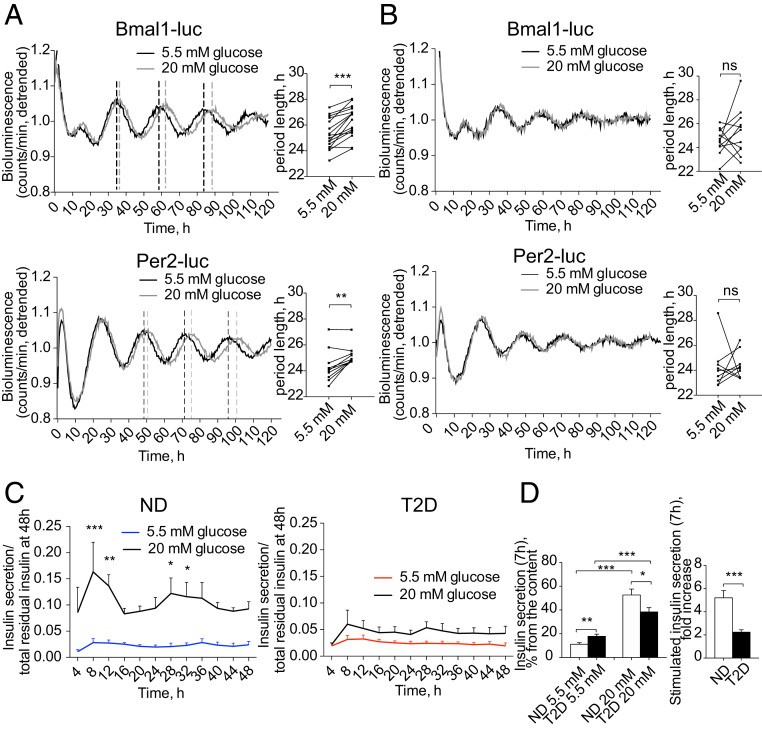
Fig. 6.
High glucose levels impact on the molecular clocks in the islets from ND, but not from T2D donors. Average detrended oscillatory profiles of forskolin-synchronized human islet cells from ND (A) and T2D donors (B) transduced with Bmal1-luc (Upper, n = 15 for ND and n = 10 for T2D) or Per2-luc lentivectors (Lower, n = 9 for ND and n = 8 for T2D). Adjacent histograms show changes in the period length of islet oscillations recorded in the presence of 20 mM glucose in the medium (difference is tested by paired Student’s t test). (C) Insulin secretion by mixed islet cells synchronized with forskolin and perifused in parallel with the medium containing either 5.5 mM or 20 mM glucose across 48 h (n = 3 of ND and n = 5 T2D donors). Two-way ANOVA test with Bonferroni posttest was used to assess the difference between experimental conditions. (D) Static release (Left) of insulin by dispersed islet cells from ND or T2D donors was measured after 7-h incubation in the presence of 5.5 or 20 mM glucose, and expressed as percent of total residual insulin content in the end of the experiment (mean ± SEM) for n = 10 ND and n = 10 T2D preparations. Respective stimulation index is expressed (Right). *P < 0.05, **P < 0.01, and ***P < 0.001. ns, not significant. See also SI Appendix, Fig. S4.

