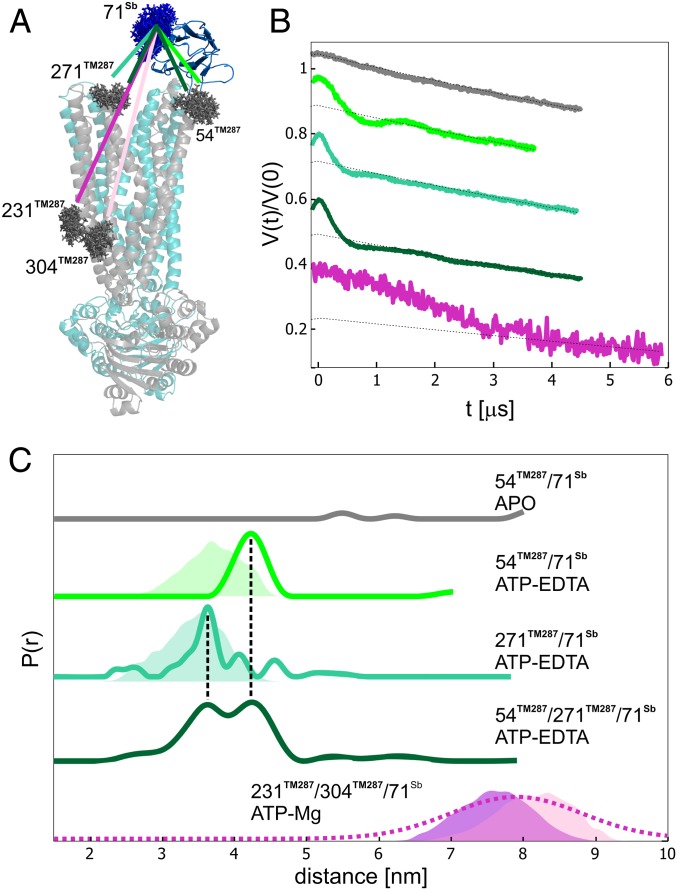
Fig. 3.
Sybody binding to the transporter via Gd–nitroxide distances. (A) Sybody-bound crystal structure of TM287/288 in the OF state (PDB file: 6QV0). The spin-labeled residues (MTSL on the transporter, in gray, and Gd-maleimide-DOTA, in blue, on the sybody) are depicted with the rotamers predicted by MMM2018. (B) Primary Gd–nitroxide DEER data. (C) Distance distributions obtained with Tikhonov regularization for the different transporter/sybody systems and simulated distance distributions (shaded areas). For the 231TM287-304TM287-71Sb complex, the predicted distance distribution for 231TM287-71Sb is displayed in purple, while the 304TM287-71Sb distance is colored in pink. The extracted distance distribution for this pair was obtained by Gaussian model fit (dashed line) to stabilize the output distances with respect to a Tikhonov model-free fit. The corresponding form factors and error estimations are shown in SI Appendix, Fig. S6.

