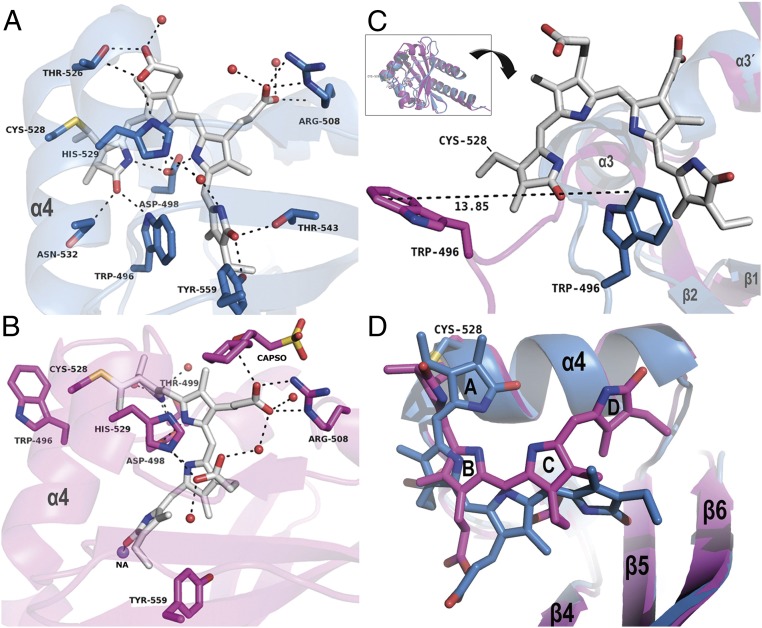
Fig. 2.
Comparison of the chromophore protein interactions in the Pr and Pg state. (A) Binding site of Slr1393g3-Pr; the chromophore (gray sticks) is in the Z,Z,Z,s,s,a configuration. (B) Binding site of Slr1393g3-Pg; the chromophore (gray sticks) is in the Z,Z,E,s,s,a configuration. In A and B, helix α4 is labeled for clarity; residues interacting with the chromophore are represented as sticks and are labeled individually, water molecules as red spheres, and sodium as purple sphere. Distances are given in SI Appendix, Table S2. (C) The Inset on Top shows an overview of the superimposed structures of Slr1393g3-Pr (blue cartoon; PDB ID code 5DFY) and Slr1393g3-Pg (magenta; PDB ID code 5M82). Below the Inset, the structure is rotated for a detailed view on the movement of Trp496; for clarity, the PCB chromophore in Pg state is omitted; the Pr-Trp is shown in blue, and Pg-Trp in magenta. (D) Detailed view on the chromophore conformation of both states with color coding adapted from C. The PCB molecule in the Pg state is, compared with the Pr state, closer to helix α4 and has moved further into the binding site.

