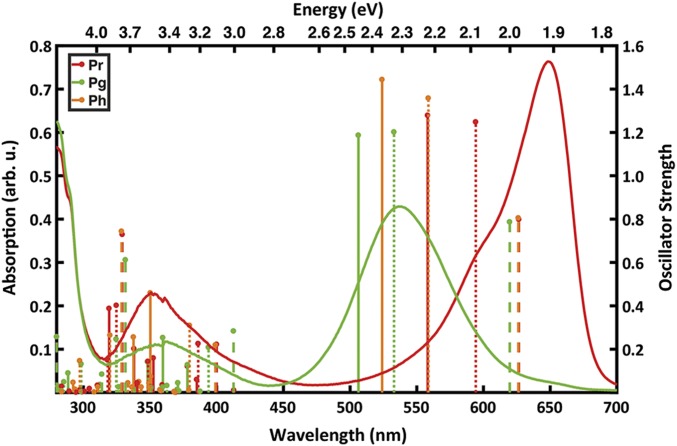
Fig. 5.
Experimental absorption spectra and calculated excitation energies of Slr1393g3. The experimental absorption spectra (9) are shown as lines for Pr (red) and Pg (green). The calculated excitation energies are represented as sticks for the Pr (red), Pg (green), and the hybrid Ph (orange) forms. The vacuo models are represented by dashed lines, strained models by dotted lines, and protein models as solid sticks. The height of each stick is proportional to the oscillator strength of the corresponding transition.

