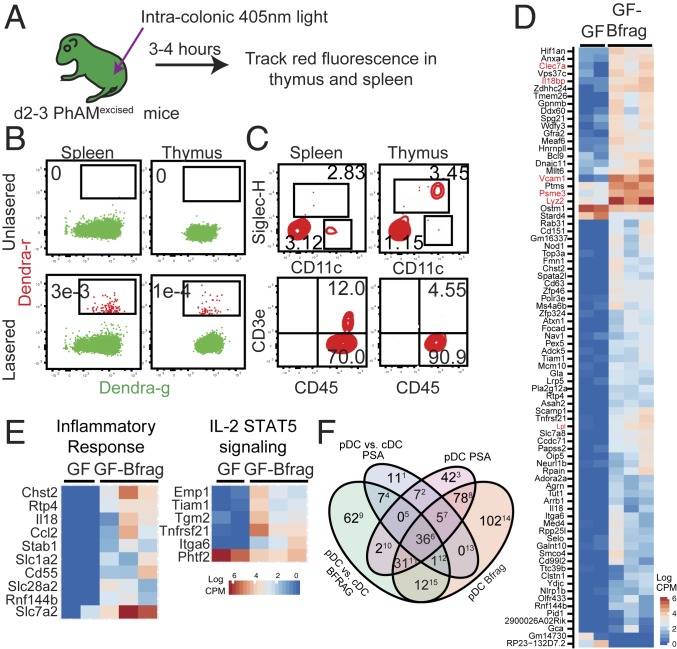
Fig. 3.
pDCs from the colon migrate to the thymus in early life. (A) Newborn (d0–2) PhAMexcised mice were exposed to 405 nm light to photoconvert Dendra-g protein to Dendra-r protein by intracolonic exposure. Dendra-r+ cells were identified by flow cytometry 3 to 4 h after photoconversion. (B) Representative flow cytometry plots showing expression of Dendra-g and Dendra-r fluorescences in the thymus and spleen. Frequency of Dendra-r+ cells is shown. (C) Expression of (Top) CD11c (x axis) and SiglecH (y axis) and (Bottom) CD45 (x axis) and CD3e (y axis) on Dendra-r+ cells in the spleen and thymus of photoconverted pups. Frequency of CD11+SiglecH+ pDCs, CD11c+SiglecHneg conventional DCs (cDCs), and CD45+CD3e+ T cells is shown. Data in B and C are representative of a minimum of 10 independent experiments. (D) Thymic pDCs from d14 GF and GF-Bfrag pups were analyzed by RNA-sequencing (RNA-seq). Differentially expressed genes between thymic pDCs from GF and GF-Bfrag mice were filtered to include only those genes that were differentially expressed in a pDC^(GF vs. Bfrag) and cDC^(GF. vs. Bfrag) (cDC: CD11chi) comparison to exclude genes that changed in both pDCs and cDCs as a result of B. fragilis monocolonization. The heat map shows expression of these 80 genes in GF and GF-Bfrag thymic pDCs. (E) The heat map of differentially expressed genes between GF and GF-Bfrag thymic pDCs contained in selected significant (false discovery rate < 0.1) networks is shown. (F) Venn diagram showing distribution of genes and the extent of dissimilarity between pDCs from GF-Bfrag and GF-ΔPSA pups. Numbers in superscripts indicate column number in SI Appendix, Fig. S10, listing genes in each subset.

